Top tips and tools for optimising Haskell
(This blog post discusses CPU time profiling, but not space (memory) profiling. We’ll come back to that in a Part 2.) We use a range of different programming languages at Pusher and are always looking for ways to squeeze every bit of performance from them. Recently, I’ve been on a project to explore what other \[…\]
Introduction
(This blog post discusses CPU time profiling, but not space (memory) profiling. We’ll come back to that in a Part 2.)
We use a range of different programming languages at Pusher and are always looking for ways to squeeze every bit of performance from them.
Recently, I’ve been on a project to explore what other tools are out there to aid us in optimising our Haskell codebase. Here, I wanted to share a simple guide to getting started with the language and a few useful tools we’ve found to help get the most of it.
Flying flags in GHC
When using the Glasgow Haskell Compiler to turn source code into machine code, we found setting flags can reduce CPU time by around 20%. An easy way to get a quick performance boost with minimal effort:
1-funfolding-use-threshold=16 -O2 -optc-O3
To optimise further, we have to do the work ourselves. You can’t optimise what you can’t see so firstly we need to visualise performance to understand where the opportunities lie to reduce latency. Luckily GHC includes a time and space profiling system letting you identify issues with run speed and overuse of memory. Next we need to set the flags:
1-rtsopts -prof -auto-all -caf-all
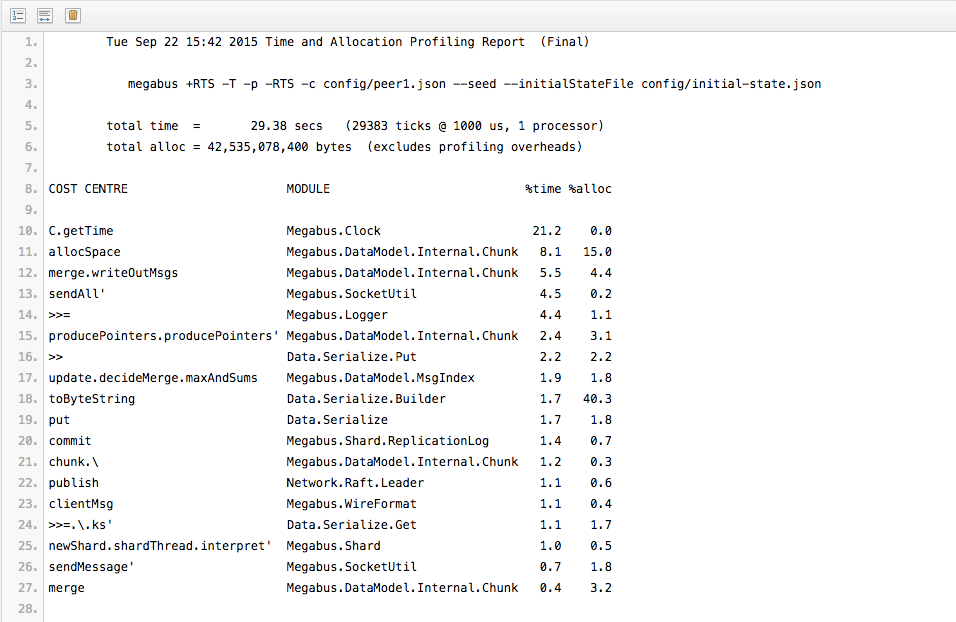
Then when the compiled program is run with the flags +RTS -p it generates a file called yourprog.prof This should look something like this:

This profile file shows the CPU time spent in each cost centre, which in this case generally correspond to functions in the source code. The cost is the time or space required to run an expression.
Learn more: ‘Compiler options for profiling’ from Haskell’s GHC user guide
You can get quite far by looking at this profile. However, whilst it makes it easy to identify expensive functions, the full call tree is hard to explore for large programs.
But worry not there’s a number of tools that help with this.
FlameGraph
Brendan D. Gregg’s FlameGraph is a language independent tool for rendering flame graphs from text based .folded files. A flame graph is a visualisation of software profiles that allows you to quickly identify the most frequent code-paths.
The first thing to do when using FlameGraph is to converts your .prof profile files into the .folded files required by FlameGraph. Fortunately there is a Haskell tool, ghc-prof-flamegraph to do just that. Then you can run FlameGraph on the resulting file to get an SVG, which can be viewed in the browser.
Learn more: Flame graphs for GHC time profiles by Francesco Mazzoli
FlameGraph’s visualisation a useful way of getting a rough idea of where the program was spending its time. We also liked the fact that the sub components of the graph can be expanded interactively.
Profiteur
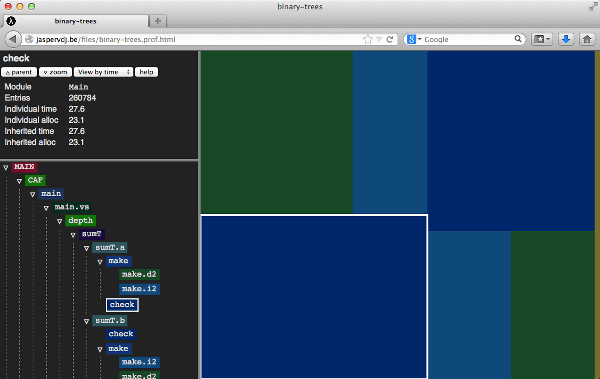
If you need to get serious then we’ve found Profiteur offers more power and precision.
Profiteur shows more stats about the time spent in each function, and importantly the children of each function. You can interactively drill down into function call by just double clicking the squares on the right. The size of each square represents the CPU time taken to execute the function.

Learn more: Profiteur: a visualiser for Haskell GHC .prof files by Jasper Van der Jeugt
The next step is to learn how to profile threads.
Thread profiling
First of all compile your program with:
1-threaded -eventlog -rtsopts
Then run the program with
1+RTS -ls -NX
(X is the number of cores to run the program on)
Now it’s time to use tools to look into threads
Threadscope has a great little UI – features like Zooming make it quick to hone in on specific areas. It also does a great job revealing the impact of garbage collection.
However, it only shows OS threads. To dig deeper, you need to use Well-Typed’s ghc-events-analyze.
Well-Typed’s tool breaks down program by greenthreads. Haskell programs run on many virtual (green) threads that are scheduled within a single OS thread, therefore this tool provides much more fine grained insight.
We found the tool much more useful once we had labelled threads using the function labelThread, which gives them names in the output graph. This was almost essential to get a breakdown of time spent in each greenthread over time. We also found ghc-events-analysize to be very useful to breakdown the latency of the program.
Additionally, you can use the function traceEventIO to label periods of time, these are then rendered in the output graph.
So, for example if you want to see which part of a program a particular requests spends most of its time in, you can label each component, and the graph will show regions of time that correspond to these labels.
Learn more: Performance profiling with ghc-events-analyze from Well-Typed’s blog
One drawback to be aware of when using Well-Typed’s tools is that output is just an SVG image with no interactivity. It’s also worth mentioning that sometimes, we found the software to be a bit unreliable and discovered bugs in the generated SVG files. So it’s always good to keep a keen eye on what is being output.
Haskell Folks
What we’ve covered above should be enough to get you started. These tips and tools will help you get the most out of Haskell’s framework enabling you to improve performance quite dramatically.
We hope you find these useful and look forward to hearing your thoughts. Soon I’ll be following up with part 2, taking a closer look at memory profiling, in the meantime if you have any questions don’t hesitate to get in touch. Oh, and we are hiring.