- Products

- Developers
- User stories
- Blog
- Pricing

Build a trade platform using JavaScript
Introduction
Stock market data becomes more valuable as it essentially delivers an opportunity for traders who seek analysis and statistics.
In this tutorial we will be building a trade platform that portrays the experience for stock markets, where trades in prices can be visualized in realtime. This will be built using JavaScript, Chart.js and realtime capabilities powered by Pusher.
Pusher is a platform that specializes in building realtime infrastructures for developers in order to build realtime applications as efficiently as possible. We will be leveraging the powerful features of Pusher to show updated prices on our chart directly from the server and also add an extra feature to display a table depicting the prices as shown below:
https://www.youtube.com/watch?v=5Tee_2EkCW0&
Getting started
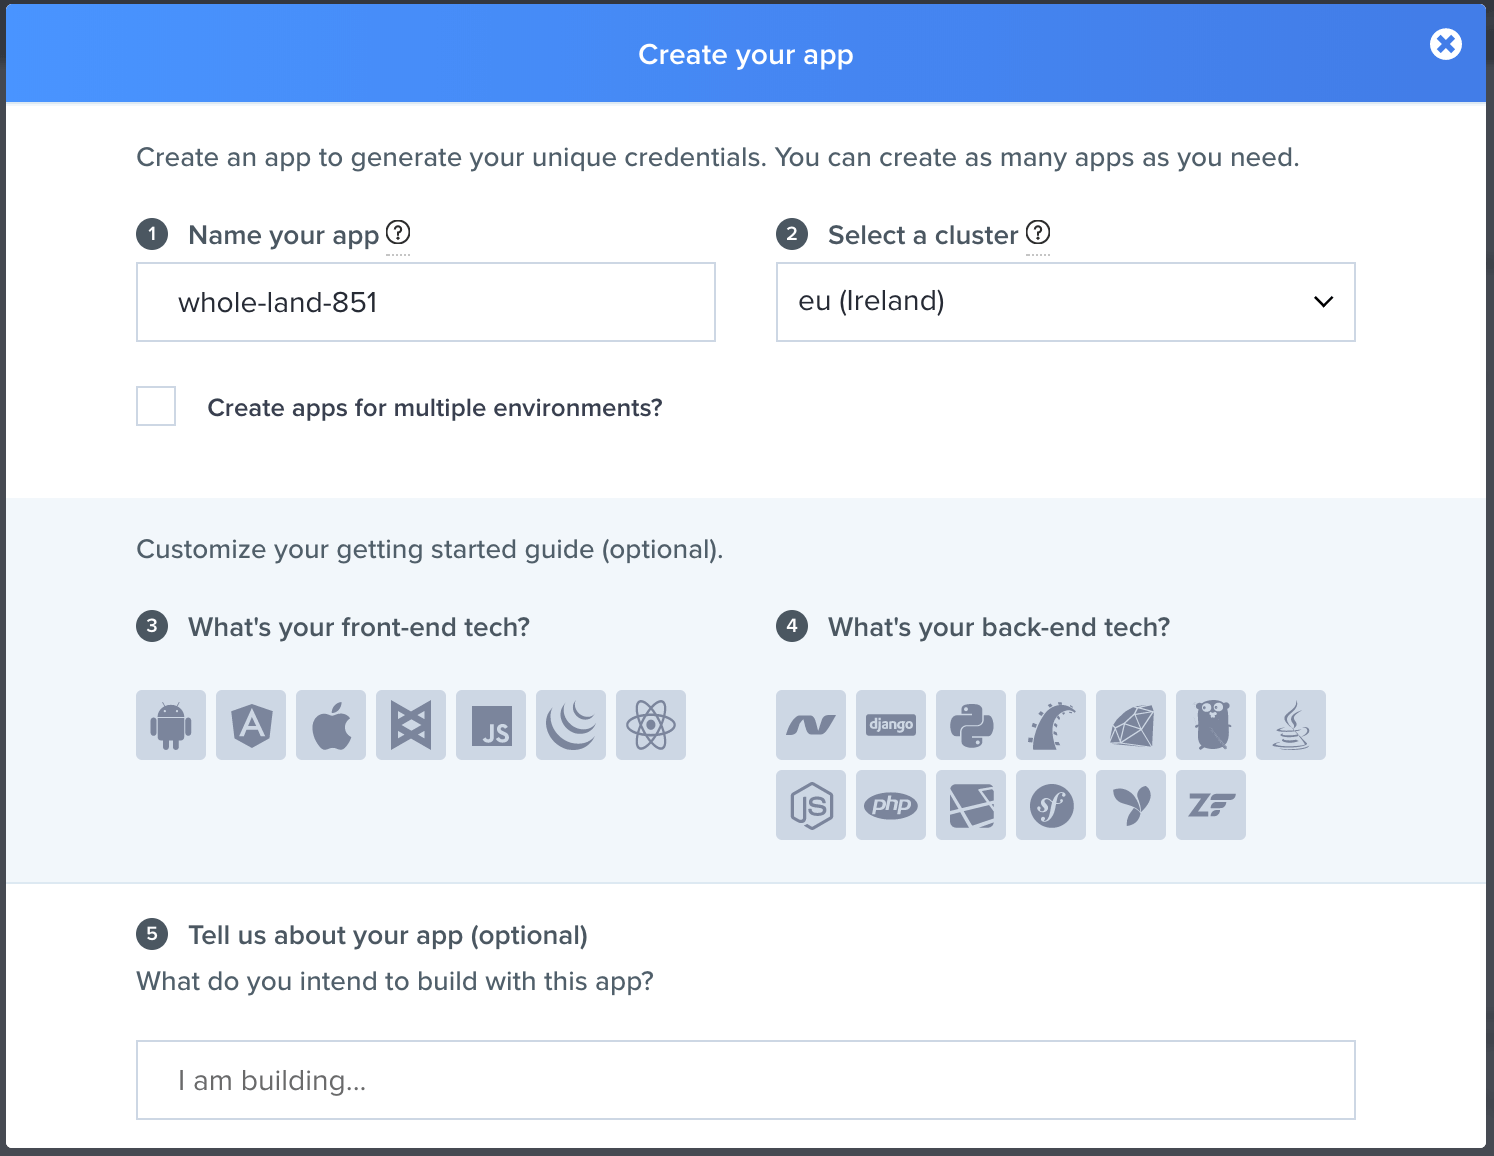
As stated earlier, Pusher will be used to easily deliver the realtime functionality necessary for our chart to function as specified. If you don’t have an account with Pusher, you can sign up for free. Once you are done, go ahead and create a new app from your dashboard. Don’t forget to take note of your app_id, key, secret and cluster as you will be required to use them later in this tutorial.
Set up application
Now that we have set up an account and obtained the necessary credentials, we will need to set up a server and the view for our application. This is to ensure communication between our application and Pusher. If you do not have Node and npm installed on your machine yet, kindly download them from here in order to follow along. Otherwise, proceed creating a new directory with any name and run the command below :
npm init -y
You will be asked a bunch of questions, and then a package.json file will be created for you. Update the file with the following:
1## package.json 2 { 3 "name": "sample-stock", 4 "version": "1.0.0", 5 "description": "", 6 "main": "index.js", 7 "scripts": { 8 "test": "echo \"Error: no test specified\" && exit 1", 9 "serve": "node server.js", 10 "dev": "serve --port 5200" 11 }, 12 "keywords": [], 13 "author": "", 14 "license": "ISC" 15 }
Now edit the file above by adding the script to start our local server, we will set this up in a bit.
1## package.json 2 { 3 ... 4 "scripts": { 5 "test": "echo \"Error: no test specified\" && exit 1", 6 "serve": "node server.js", 7 "dev": "serve --port 5200" 8 }, 9 ... 10 }
We need to install the Pusher SDK and also serve to help us launch the client app:
1# Pusher 2 npm install --save pusher 3 4 # Serve 5 npm install --save-dev serve
We also need some existing dummy data in order to create a proper simulation of stock trades and price variations. For this reason, I downloaded a data sample of previous stock history we can play with. Below is the truncated version of the stock.json. You can find the complete file here.
1{ 2 ... 3 "Timestamp": "06/15/2011 09:30:00.050", 4 "Quantity": 6820, 5 "Price": 23.98, 6 "Exchange": "The NASDAQ Stock Market LLC", 7 "MarketCenter": "Q", 8 "SubMarketCenter": " ", 9 "TRDI": "@O X", 10 "CanceledIndicator": null, 11 "DOTT": "F", 12 "ITY": "Q", 13 "MSN": 2059, 14 "OMSN": 0 15 }, 16 ...
Next, we need to create our project files. In the project folder add the following files and leave them blank. We will fill up the content as we go:
1- app.js 2 - server.js 3 - index.html 4 - style.css 5 - stock.json
Create a simple server
Within server.js, import the stock``.json file and initialise Pusher with the required credentials obtained from the application dashboard.
1// ./server.js 2 const stockData = require('./stock.json'); 3 const Pusher = require('pusher'); 4 5 6 var pusher = new Pusher({ 7 appId: 'APP_ID', 8 key: 'APP_KEY', 9 secret: 'APP_SECRET', 10 cluster: 'APP_CLUSTER', 11 encrypted: true 12 }); 13 ...
For our clients to receive realtime payloads, we need to emit those payloads from our sever using Pusher:
1// ./server.js 2 let i = 0; 3 setInterval(() => { 4 const GOOG = stockData[1]['Trades'][i]; 5 pusher.trigger('trade', 'stock', GOOG); 6 i++; 7 }, 2000);
Every 2 second, we query the JSON file for GOOG stock prices and and emit this price alongside some other payload (like the stock name) as JSON using the Pusher’s trigger method. This method takes channel, event, and payload as arguments.
Run the following command to start the server:
npm run serve
Build the client app
First things first, update your index.html with the following:
1<html> 2 3 <head> 4 <link rel="stylesheet" href="./style.css"> 5 <link rel="stylesheet" href="https://maxcdn.bootstrapcdn.com/bootstrap/3.3.7/css/bootstrap.min.css"> 6 </head> 7 8 <body> 9 <div class="container"> 10 <div class="chart-container row"> 11 <div class="col-md-8"> 12 <div class=""> 13 <canvas id="chart"></canvas> 14 </div> 15 </div> 16 17 <div class="col-md-4"> 18 <div class="table-container"> 19 <h2>Trending Tickers</h2> 20 <table class="table"> 21 <thead> 22 <tr> 23 <th> Name</th> 24 <th> Price</th> 25 </tr> 26 </thead> 27 <tbody> 28 <tr> 29 <td>GOOG</td> 30 <td id="price"></td> 31 </tr> 32 </tbody> 33 </table> 34 35 </div> 36 </div> 37 </div> 38 </div> 39 40 <script src="https://js.pusher.com/4.1/pusher.min.js"></script> 41 <script src="https://cdnjs.cloudflare.com/ajax/libs/Chart.js/2.4.0/Chart.min.js"></script> 42 <script src="app.js"></script> 43 </body> 44 45 </html>
You have a canvas where you will launch the chart as well as a simple table to show the current prices as they are updated in realtime. We also included the Pusher and Chart SDK which we will use soon.
App Class
To receive the payload sent in from the server, we need to subscribe to the Pusher event emitted by the server. And to visualize it, you need to create a chart and keep updating it’s data points using the payload received from the server. We will need a couple of functions:
1// app.js 2 class App { 3 constructor() { 4 this.pusher = null; 5 this.chart = null; 6 this.lowestPrice = 505; 7 this.initializeChart(); 8 this.initializePusher(); 9 } 10 initializePusher() { 11 ... 12 } 13 subscribeToEventChannel() { 14 ... 15 } 16 updateChartData(data) { 17 ... 18 } 19 20 initializeChart() { 21 ... 22 } 23 } 24 new App();
We just created the methods bodies. Next is to start implementing their functionalities one after the other.
First, let’s initialize Pusher
1// app.js 2 initializePusher() { 3 Pusher.logToConsole = true; 4 this.pusher = new Pusher('APP_ID', { 5 cluster: 'APP_CLUSTER', 6 encrypted: true 7 }); 8 this.subscribeToEventChannel(); 9 }
For debug purposes only, we are setting Pusher.logToConsole to true so as to see the realtime activities logged to the console. Remember to remove that in production so you don’t leave your user’s console bloated with debug logs.
Next, we create an instance of Pusher. The constructor function is available in the pusher-js file we included earlier.
Remember the server is still emitting data. We need to subscribe to it and start consuming the data coming in:
1// app.js 2 subscribeToEventChannel() { 3 const channel = this.pusher.subscribe('trade'); 4 channel.bind('stock', data => { 5 this.updateChartData(data) 6 }); 7 }
The subscribe method on Pusher takes a channel we need to subscribe and returns a subscription. We can then bind to this subscription using bind and passing it the event’s name and a callback function.
In the event, we called updateChartData and passed it the data to keep updating the chart. We create an instance variable in the constructor called chart. We also called the initializeChart method to setup the chart in the constructor as well. Before we see the update chart logic, let’s see how this chart is initialized:
1// app.js 2 initializeChart() { 3 const ctx = document.getElementById('chart').getContext('2d'); 4 const data = { 5 labels: [], 6 datasets: [ 7 { 8 label: 'GOOG', 9 backgroundColor: 'rgb(125, 195, 242)', 10 borderColor: 'rgb(54, 162, 235)', 11 data: [], 12 // fill: false 13 } 14 ] 15 }; 16 this.chart = new Chart(ctx, { 17 type: 'line', 18 data: data, 19 options: { 20 responsive: true, 21 title: { 22 display: true, 23 text: 'Chart.js Line Chart' 24 }, 25 tooltips: { 26 mode: 'index', 27 intersect: false 28 }, 29 hover: { 30 mode: 'nearest', 31 intersect: true 32 }, 33 scales: { 34 xAxes: [ 35 { 36 display: true, 37 scaleLabel: { 38 display: true, 39 labelString: 'Time ' 40 } 41 } 42 ], 43 yAxes: [ 44 { 45 display: true, 46 scaleLabel: { 47 display: true, 48 labelString: 'Price' 49 }, 50 ticks: { 51 min: 504, 52 max: 507 53 } 54 } 55 ] 56 } 57 } 58 }); 59 }
It might look overwhelming, but a closer look shows that we are just defining a chart and describing what kind of data it should expect, how it should label the data, and how it should look.
Now, the update chart method uses the chart instance to update the chart every single time data comes in from the Pusher server.
1// app.js 2 updateChartData(data) { 3 this.chart.data.labels.push(data.Timestamp.split(' ')[1].split('.')[0]); 4 this.chart.data.datasets[0].data.push(data.Price); 5 this.chart.update(); 6 }
You can launch the client app with the following command:
1## Run the web application 2 npm run dev
This will start the web application on port 5200. Open up up your browser:
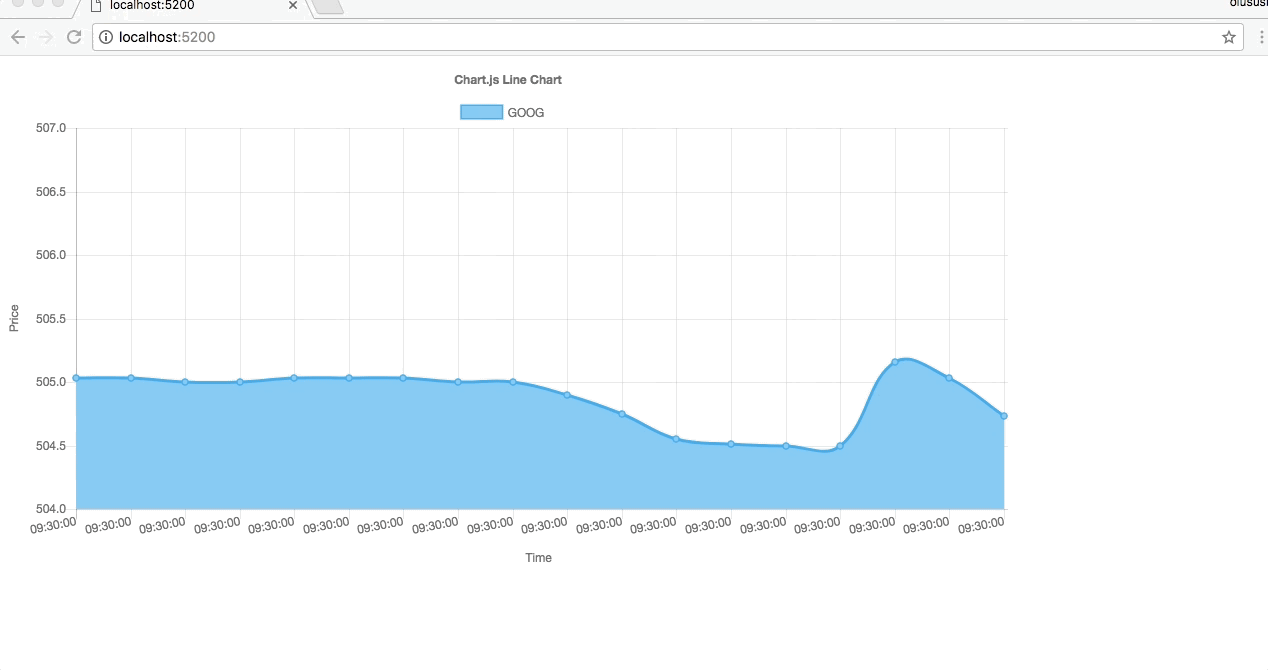
Realtime ticker
At the moment, thanks to Pusher’s functionality, we are able to update the chart in realtime with the payload sent in by the server. Let’s proceed by adding another feature to display the prices on a table.
We will choose a random price to be set as a threshold in order to determine when the price increases or decreases as it is being received from the server. These changes in prices will be indicated with different colors as it is obtainable in any stock market chart.
Remember we had the following table in our index.html:
1<html> 2 <h2>Trending Tickers</h2> 3 <table class="table"> 4 <thead> 5 <tr> 6 <th> Name</th> 7 <th> Price</th> 8 </tr> 9 </thead> 10 <tbody> 11 <tr> 12 <td>GOOG</td> 13 <td id="price"></td> 14 </tr> 15 </tbody> 16 </table>
To make this work we will edit the updateChartData() method and also create a new one called flashColor``(). The new method will be used to change the colors based on the changes in prices.
1## app.js 2 updateChartData(data) { 3 ... 4 5 document.getElementById('price').innerHTML = data.Price; 6 this.chart.data.datasets.forEach(dataset => { 7 var currentPrice = document.getElementById('price'); 8 var tag = currentPrice.innerHTML; 9 tag = data.Price; 10 this.flashColor(this.threshold, tag, currentPrice); 11 }); 12 this.chart.update(); 13 }
Don’t forget to include the threshold price within the constructor like this :
1// app.js 2 class App { 3 constructor() { 4 ... 5 ## add this 6 this.threshold = 505; 7 } 8 } 9 new App();
For visual cues, here is a function that changes the color of the price text every single time the threshold is beat :
1// app.js 2 flashColor(threshold, tag, currentPrice) { 3 let color = " "; 4 if (tag > threshold ) { 5 color = "green"; 6 } else if(tag == threshold){ 7 color = "blue"; 8 } else { 9 color = "red"; 10 } 11 currentPrice.style.color = color; 12 currentPrice.style.fontWeight = "bolder"; 13 }
And that is it :
https://www.youtube.com/watch?v=5Tee_2EkCW0&
From the chart, the green color for prices means that the price has gone above the threshold while red indicates reduction in price and blue means it is exactly the same as the threshold price.
Conclusion
From this tutorial, we have seen how to build a stock market like platform where changes in prices are being updated in realtime. This can be built upon and used with any chart library. In case you miss anything, the complete code can be found on GitHub. You can find it here and please feel free to submit a pull request.


© 2026 Pusher Ltd. All rights reserved.
Pusher Limited is a company registered in England and Wales (No. 07489873) whose registered office is at MessageBird UK Limited, 3 More London Riverside, 4th Floor, London, United Kingdom, SE1 2AQ.