Creating a server health monitoring app with Laravel
Introduction
There are lots of server monitoring solutions out there. Most popular among them are Datadog and New Relic. Some server infrastructure providers such as DigitalOcean also comes with basic server monitoring features such as disk, CPU, and memory. There are also open-source solutions such as Nagios. But more often than not, especially on small projects, a lot of the functionality that these services offer is more than what you need. Aside from that, they’re usually not cheap.
If you’re like me and all you want is some basic functionality such as realtime monitoring of whether specific software on your server is running or not, then creating your own server monitoring app is the way to go.
In this tutorial, we’ll be creating a live server monitoring app with Laravel and Pusher Channels.
Prerequisites
Knowledge of PHP is required to follow this tutorial. You also need to know basic server management for infrastructure providers like DigitalOcean or Linode. Things like generating ssh keys and adding them to your remote server.
Development environment You need to have Apache, PHP, Composer, MySQL, and Node installed on your machine. The easiest way to follow this tutorial if you don’t already have the development environment is to use either Laravel Homestead or Laravel Valet. If you have a bit more time, you can install Laradock instead. This is the same environment that I’ve used for creating this tutorial.
Out of the box, Laravel Homestead and Laradock will come pre-installed with the required software.
If you opt for Laravel Valet, you also need to install PHP, Composer, MySQL, and Node separately. For the HTTP server, it’s going to use PHP’s built-in server instead of Apache. Just follow their documentation for the instructions.
A remote server to be monitored is also required. Don’t assign a password to the ssh key you generate as the tool that we will be using for logging in remotely to the server doesn’t support logging in with ssh keys that require a password. This tutorial won’t be covering how to add ssh keys to a remote server. But if you’re using a Linux-based server, all you have to do is log in to it and append your local machine’s public ssh key to the ~/.ssh/authorized_keys file in the server.
To use Pusher Channels, ceate a free sandbox Pusher account or sign in. Then create an app instance to use for testing.
Package versions The following package versions are used for the app:
- laravel/framework 5.8
- pusher/pusher-php-server 4.0
- spatie/laravel-server-monitor 1.0
You don’t have to use the same versions, but it’s good to know if you encounter any compatibility issues.
App overview
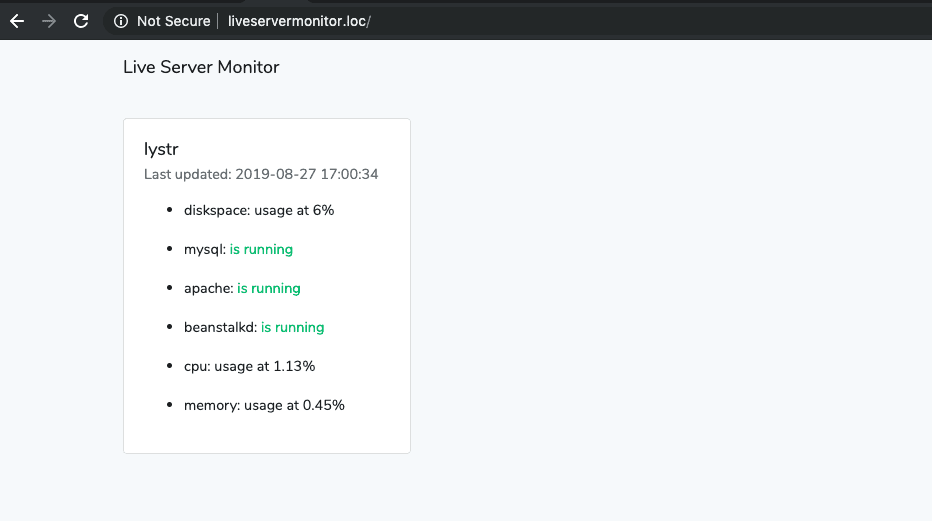
We’ll be building a live server monitor that will constantly check for various server status such as disk space, CPU, and memory. It will also check if the software you’re using to run your server is running or not. The data on the page will automatically be updated at a specific interval.
Here’s what the app will look like:
You can view the code on its GitHub repo.
Bootstrapping the app
Let’s get started by creating a new Laravel project:
composer create-project --prefer-dist laravel/laravel liveservermonitor
This will create a new liveservermonitor folder on your working directory. Navigate inside that and it will serve as the root directory for this project.
Create and add the database config Log in to the MySQL server and create the database that we will be using to store the status of the servers to be monitored:
1mysql -u root -p 2 CREATE DATABASE server_monitor;
Next, open the .env file and set your database credentials. Replace the values for the one’s which starts with YOUR_:
1DB_CONNECTION=mysql 2 DB_HOST=YOUR_DB_HOST 3 DB_PORT=3306 4 DB_DATABASE=server_monitor 5 DB_USERNAME=YOUR_DB_USERNAME 6 DB_PASSWORD=YOUR_DB_PASSWORD
Install the backend dependencies Next, we need to install the libraries we need:
composer require spatie/laravel-server-monitor pusher/pusher-php-server
Here’s a breakdown of what each one does:
- spatie/laravel-server-monitor - for implementing server monitoring features.
- pusher/pusher-php-server - for implementing realtime communication between the backend and the frontend of the app.
Once the libraries are installed, we need to register the service provider for the laravel-server-monitor package. Open the config/app.php file and add the following under the providers array. While you’re there, uncomment the Broadcast service provider as well. This will let us use the event broadcasting feature in Laravel. We use it to broadcast the event for when laravel-server-monitor has finished checking the server status:
1'providers' => [ 2 // ... 3 App\Providers\BroadcastServiceProvider::class, // uncomment this 4 Spatie\ServerMonitor\ServerMonitorServiceProvider::class, // add this 5 ];
Next, generate the migration files for creating the tables to be used by laravel-server-monitor then run the migrations:
1php artisan vendor:publish --provider="Spatie\ServerMonitor\ServerMonitorServiceProvider" --tag="migrations" 2 php artisan migrate
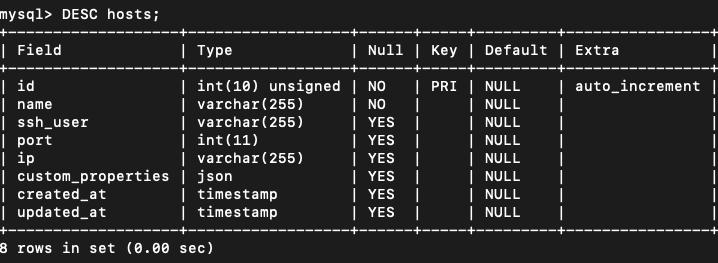
This will create the hosts table:
And the checks table:
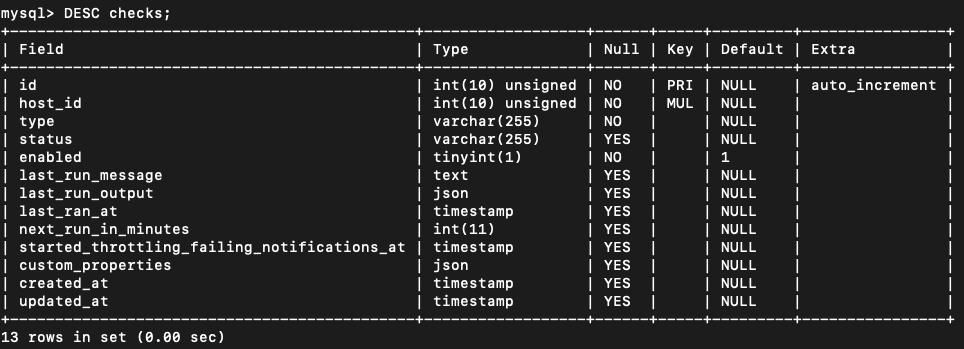
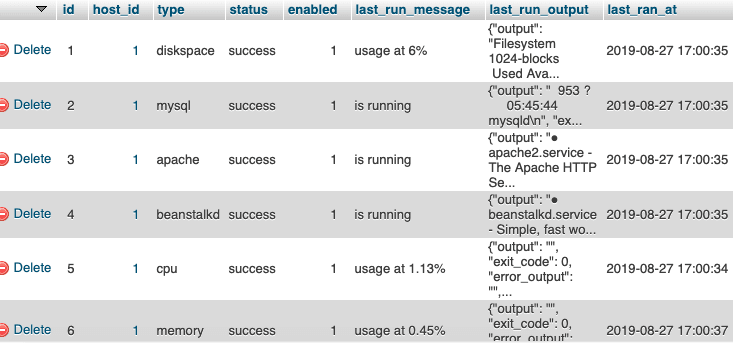
The hosts table stores all the information about the remote servers to be monitored, while the checks table stores the information for the various checks that you’ve added for each of the server (for example, disk space and MySQL).
Lastly, generate the configuration file for the laravel-server-monitor. This will create a config/server-monitor.php file. This is where we can configure the various settings for the library:
php artisan vendor:publish --provider="Spatie\ServerMonitor\ServerMonitorServiceProvider" --tag="config"
Install the frontend dependencies After installing and configuring the backend dependencies, we can also install the frontend dependencies. First, install the default frontend libraries which Laravel depends on (includes Bootstrap, jQuery, and others):
npm install
NOTE: This includes a bunch of libraries which we won’t be using. But we won’t really be importing them in any of our scripts so it’s okay even if we don’t remove them from the
package.jsonfile.
Once those are installed, we also need to install our own dependencies:
npm install --save laravel-echo pusher-js visibilityjs
Here’s a break down of what each one does:
- laravel-echo - this will let us configure Pusher Channels as a broadcaster. You can also use the pusher-js library directly if you’re sure you won’t be needing to use any other realtime subscription channels in the future. Using Laravel Echo is simply a convenience utility for normalizing the APIs.
- pusher-js - the client-side component of Pusher Channels. Laravel Echo uses it behind the scenes to establish realtime communication between the backend and the frontend.
- visibilityjs - for listening for when the page visibility changes. This acts as a wrapper to the Page Visibility API so it’s easier to use (normalized API across browsers).
Building the app
Now we’re ready to build the app. We’ll first add the custom system checks, then we’ll create a custom notification channel so that the server has a way of notifying us when the system checks finishes running. After that, we’ll work on the frontend side of the app. Then finally, we’ll add the remote servers to be monitored and run the system checks.
First, open the config/server-monitor.php file and inspect the checks array. These are the server checks that are built into laravel-server-monitor. In this tutorial, we won’t be using elasticsearch and memcached because the remote server that I’ll be using for testing doesn’t have it installed. From here, you can uncomment any checks that you don’t need. Though only do that if you’re sure that you won’t be using it in any of the servers you want to add for monitoring. You can actually disable specific checks to a server that’s already being monitored. I’ll show you how later:
1// config/server-monitor.php 2 'checks' => [ 3 'diskspace' => Spatie\ServerMonitor\CheckDefinitions\Diskspace::class, 4 'elasticsearch' => Spatie\ServerMonitor\CheckDefinitions\Elasticsearch::class, 5 'memcached' => Spatie\ServerMonitor\CheckDefinitions\Memcached::class, 6 'mysql' => Spatie\ServerMonitor\CheckDefinitions\MySql::class, 7 ]
Aside from removing unneeded checks, this is also where we can add custom checks for checking if the software you’re using to run the server is running. And that’s exactly what we’ll be doing next. Specifically, we’ll add the following:
- Check if Apache is running
- Check if Beanstalkd is running
- Get the memory usage
- Get the average CPU usage
Checking if Apache is running
First, we’ll add the class for checking if Apache is running. You can do that by creating a SystemChecks folder inside the app directory and inside it create an Apache.php file:
1<?php 2 // app/SystemChecks/Apache.php 3 namespace App\SystemChecks; 4 use Spatie\ServerMonitor\CheckDefinitions\CheckDefinition; 5 use Symfony\Component\Process\Process; 6 7 class Apache extends CheckDefinition 8 { 9 public $command = 'service apache2 status'; 10 11 public function resolve(Process $process) 12 { 13 if (str_contains($process->getOutput(), 'active (running)')) { 14 $this->check->succeed('is running'); 15 return; 16 } 17 18 $this->check->fail('is not running'); 19 } 20 }
From the code above, you can see that we need to import both the Spatie\ServerMonitor\CheckDefinitions\CheckDefinition and Symfony\Component\Process\Process class to create a system check class. The class that you create has to extend the CheckDefinition class.
This requires you to add a public $command and implement the resolve() function. The $command, as the name suggests is the command used for checking the status of the software you want to check. Good thing there’s already a built-in diagnostics tool for Apache, so all we have to do is call it from here:
public $command = 'service apache2 status';
If you execute the same command on the terminal you’ll get an output similar to the following:
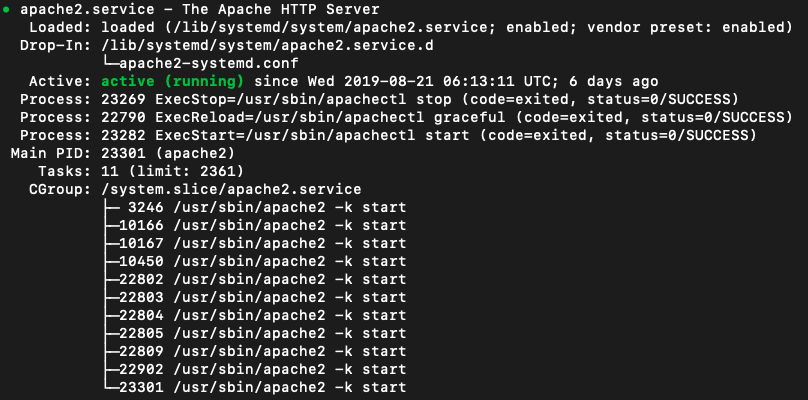
Next, inside the resolve() function, we get access to the $process because it’s passed as an argument. From here, all we have to do is check if the output string contains “active (running)”. If you check the terminal output above, it contains that same string in green so we know that the server is running if that’s present in the output. We then call $this->check->succeed('is running') to set the status of the check:
1if (str_contains($process->getOutput(), 'active (running)')) { 2 $this->check->succeed('is running'); // set status 3 return; 4 }
Checking if Beanstalkd is running
Create an app/SystemChecks/Beanstalkd.php file and add the following. This does pretty much the same thing as the Apache check. The only difference is the command we’re executing:
1<?php 2 // app/SystemChecks/Beanstalkd.php 3 namespace App\SystemChecks; 4 use Spatie\ServerMonitor\CheckDefinitions\CheckDefinition; 5 use Symfony\Component\Process\Process; 6 7 class Beanstalkd extends CheckDefinition 8 { 9 public $command = 'service beanstalkd status'; 10 11 public function resolve(Process $process) 12 { 13 if (str_contains($process->getOutput(), 'active (running)')) { 14 $this->check->succeed('is running'); 15 return; 16 } 17 18 $this->check->fail('is not running'); 19 } 20 }
Getting average CPU usage
Create an app/SystemChecks/CPUUsage.php file and add the following. This is a bit different from the previous two because even though we’re extending from the CheckDefinition class, we aren’t actually implementing it 100%. We’re setting an empty command because the Symfony Process component which is used by laravel-server-monitor doesn’t seem to be able to handle piping directly with awk (a text processing tool) for the command line). So what we do is execute the command ourselves instead.
Since there’s usually a threshold in which we consider the CPU to be at a normal operating rate, we also need to add a separate config for that inside config/server-monitor.php. That’s what we’re getting when we call config('server-monitor.cpu_usage_threshold'). There are two thresholds: warn and fail. If the current CPU usage percentage is either of those two, we set the check status to whatever it falls into. Otherwise, we assume that the CPU is operating at a normal rate and set the status to succeed:
1<?php 2 // app/SystemChecks/CPUUsage.php 3 namespace App\SystemChecks; 4 5 use Spatie\ServerMonitor\CheckDefinitions\CheckDefinition; 6 use Symfony\Component\Process\Process; 7 8 class CPUUsage extends CheckDefinition 9 { 10 public $command = ""; 11 12 public function resolve(Process $process) 13 { 14 $percentage = $this->getCPUUsagePercentage(); 15 $usage = round($percentage, 2); 16 17 $message = "usage at {$usage}%"; 18 $thresholds = config('server-monitor.cpu_usage_threshold'); 19 20 if ($percentage >= $thresholds['fail']) { 21 $this->check->fail($message); 22 return; 23 } 24 25 if ($percentage >= $thresholds['warning']) { 26 $this->check->warn($message); 27 return; 28 } 29 30 $this->check->succeed($message); 31 } 32 33 // next: add code for getting CPU percentage 34 }
Here’s the function for getting the CPU percentage. This uses grep to search for lines with the “cpu” text inside the /proc/stat file. After that, we use awk to calculate the usage percentage based on the result we get when we perform arithmetic operations on the second ($2), fourth ($4), and fifth ($5) column of text in that line. Then we simply return the result by using print:
1protected function getCPUUsagePercentage(): float 2 { 3 $cpu = shell_exec("grep 'cpu ' /proc/stat | awk '{usage=($2+$4)*100/($2+$4+$5)} END {print usage}'"); 4 return (float) $cpu; 5 }
For reference, here’s what the output of cat /proc/stat looks like. So $2 is 11738, $4 is 18979 and so on:

NOTE: The function above only returns the average CPU usage since the system booted up. This lets us see whether the system is running under tremendous load for a longer period of time. If you need to get the current CPU usage, you need to use something like the
topcommand.
Getting memory usage
The last system check that we’ll add is the memory usage. Create an app/SystemChecks/MemoryUsage.php file and add the following. This works similarly to the previous one. The only difference is that we’re now directly reading from the file instead of using grep and awk, we’re using PHP’s fopen() function to read the /proc/meminfo file:
1<?php 2 namespace App\SystemChecks; 3 4 use Spatie\ServerMonitor\CheckDefinitions\CheckDefinition; 5 use Symfony\Component\Process\Process; 6 7 class MemoryUsage extends CheckDefinition 8 { 9 public $command = ""; 10 11 public function resolve(Process $process) 12 { 13 $percentage = $this->getMemoryUsage(); 14 15 $message = "usage at {$percentage}%"; 16 $thresholds = config('server-monitor.memory_usage_threshold'); 17 18 if ($percentage >= $thresholds['fail']) { 19 $this->check->fail($message); 20 return; 21 } 22 23 if ($percentage >= $thresholds['warning']) { 24 $this->check->warn($message); 25 return; 26 } 27 28 $this->check->succeed($message); 29 } 30 31 // next: add code for getting memory percentage usage 32 }
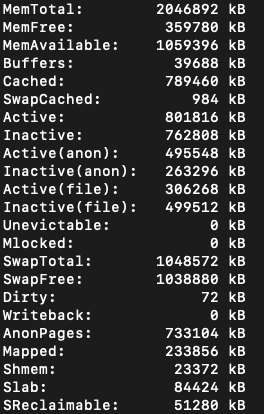
Here’s the function for getting the current memory usage. This reads from the /proc/meminfo file. This file contains various information about the system memory. We extract all number instances then divide the active memory usage from the total memory to get the memory in use:
1protected function getMemoryUsage(): float 2 { 3 $fh = fopen('/proc/meminfo', 'r'); 4 $mem = 0; 5 $all_str = ''; 6 7 while ($line = fgets($fh)) { 8 $all_str .= $line; 9 } 10 fclose($fh); 11 12 preg_match_all('/(\d+)/', $all_str, $pieces); 13 14 $used = round($pieces\[0\][6] / $pieces\[0\][0], 2); 15 return $used; 16 }
For reference, here’s the output of cat /proc/meminfo. The index count starts at 0, so the sixth value is the one beside “Active” and the first value is the one beside “MemTotal”:
Configure server monitor
Now that we’ve added all the system checks, it’s time to let laravel-server-monitor know of them. To do that, all we have to do is add them to the checks array. Use a short but descriptive name for the keys and set the path to the class as the value:
1<?php 2 // config/server-monitor.php 3 4 return [ 5 6 'checks' => [ 7 'diskspace' => Spatie\ServerMonitor\CheckDefinitions\Diskspace::class, 8 'elasticsearch' => Spatie\ServerMonitor\CheckDefinitions\Elasticsearch::class, 9 'memcached' => Spatie\ServerMonitor\CheckDefinitions\Memcached::class, 10 'mysql' => Spatie\ServerMonitor\CheckDefinitions\MySql::class, 11 12 // add these: 13 'apache' => App\SystemChecks\Apache::class, 14 'beanstalkd' => App\SystemChecks\Beanstalkd::class, 15 'cpu' => App\SystemChecks\CPUUsage::class, 16 'memory' => App\SystemChecks\MemoryUsage::class 17 ], 18 19 // ... 20 ];
At this point, we’re not really done yet. We’ve already added the custom checks but we still haven’t added a way for us to get hold of the data in realtime. That’s what we’ll be doing in the next section.
Create Pusher notification channel The next step is for us to create a custom notification channel. These notification channels automatically get triggered every time the system checks are done executing. By default, laravel-system-monitor uses Slack as a notification channel. We won’t be using it in this tutorial because all we need is realtime monitoring. For that, we will be using Pusher Channels.
1// config/server-monitor.php 2 'notifications' => [ 3 4 'notifications' => [ 5 Spatie\ServerMonitor\Notifications\Notifications\CheckSucceeded::class => ['slack'], // we need to update this so it doesn't use slack 6 // ... 7 ]
To create a custom notification channel, create a Channels folder inside the app directory and inside it create a PusherChannelsChannel.php file then add the following:
1<?php 2 // app/Channels/PusherChannelsChannel.php 3 namespace App\Channels; 4 5 use Illuminate\Notifications\Notification; 6 use Illuminate\Support\Facades\Cache; 7 use App\Events\FinishedCheck; 8 9 class PusherChannelsChannel 10 { 11 public function send($notifiable, Notification $notification) 12 { 13 if (Cache::get('page_visibility') == 'visible') { 14 15 $id = $notification->event->check->id; 16 $type = $notification->event->check->type; 17 $status = $notification->event->check->status; 18 $last_run_message = $notification->event->check->last_run_message; 19 $host_id = $notification->event->check->host_id; 20 21 event(new FinishedCheck([ 22 'id' => 'check-' . $id, 23 'type' => $type, 24 'status' => $status, 25 'last_run_message' => $last_run_message, 26 'element_class' => numberTextClass($type, $status, $last_run_message), 27 'last_update' => now()->toDateTimeString(), 28 'host_id' => 'host-' . $host_id 29 ])); 30 } 31 } 32 }
What the above code does is it first checks whether the app dashboard is currently being viewed by the user (on the foreground). If it is, it dispatches the FinishedCheck event. We’ll create this event shortly, for now, know that it’s the one responsible for triggering the message to be sent to the frontend of the app. The message contains the status of a specific system check.
Finished check event In order to send messages to the app’s frontend and update its contents without refreshing the whole page, we need to create an event which will broadcast the message using Pusher Channels. You can create the event using artisan:
php artisan make:event FinishedCheck
This creates an app/Events/FinishedCheck.php file which has already the basic boilerplate code for broadcasting events in Laravel. Replace the existing code with the following:
1<?php 2 namespace App\Events; 3 4 use Illuminate\Broadcasting\Channel; // for broadcasting to a public Pusher channel 5 use Illuminate\Foundation\Events\Dispatchable; 6 use Illuminate\Broadcasting\InteractsWithSockets; 7 use Illuminate\Contracts\Broadcasting\ShouldBroadcast; 8 9 class FinishedCheck implements ShouldBroadcast 10 { 11 use Dispatchable, InteractsWithSockets, SerializesModels; 12 13 public $message; // the message to be sent to the client side 14 15 public function __construct($message) 16 { 17 $this->message = $message; 18 } 19 20 public function broadcastAs() 21 { 22 return 'finished.check'; 23 } 24 25 public function broadcastOn() 26 { 27 return new Channel('live-monitor'); 28 } 29 }
The most important thing in the above code is that the class should implement the ShouldBroadcast class. This lets Laravel know that this is an event class. If you implement that class, you need to supply the broadcastOn() function. Inside it, all you need to do is return a new Channel instance. This accepts the name of the public Pusher channel where you want to broadcast the event.
1public function broadcastOn() 2 { 3 return new Channel('live-monitor'); 4 }
Next, add the $message as a public property for the class. This will contain the actual message to be sent to the frontend:
public $message;
Lastly, although not required, we’re also setting a broadcastAs() function. This allows us to change the name of the event. By default it will be set to the full path of the class: App\\Events\\FinishedCheck. As you can see, it’s not really that friendly. If you specify the broadcastAs() function, the string that you return from here will be used instead:
1public function broadcastAs() 2 { 3 return 'finished.check'; 4 }
Add notification channel
Now that we’ve created both the custom notification channel and the event which it dispatches, it’s time to let laravel-server-monitor know of it. Start by importing the PusherChannelsChannel class. Then for each of the items inside the notifications.notifications array, set PusherChannelsChannel::class as an item. This allows us to trigger the event for updating the client-side for each of the available notifications:
1<?php 2 // config/server-monitor.php 3 use App\Channels\PusherChannelsChannel; // add this 4 5 return [ 6 'checks' => [ 7 // ... 8 ], 9 10 // ... 11 'notifications' => [ 12 // update this: 13 'notifications' => [ 14 Spatie\ServerMonitor\Notifications\Notifications\CheckSucceeded::class => [PusherChannelsChannel::class], 15 Spatie\ServerMonitor\Notifications\Notifications\CheckRestored::class => [PusherChannelsChannel::class], 16 Spatie\ServerMonitor\Notifications\Notifications\CheckWarning::class => [PusherChannelsChannel::class], 17 Spatie\ServerMonitor\Notifications\Notifications\CheckFailed::class => [PusherChannelsChannel::class], 18 ], 19 // ... 20 ], 21 // ... 22 ];
While we’re here, you can also add the CPU and memory usage thresholds after the diskspace threshold:
1// ... 2 3 'diskspace_percentage_threshold' => [ 4 'warning' => 80, 5 'fail' => 90, 6 ], 7 8 // add these 9 'cpu_usage_threshold' => [ 10 'warning' => 70, 11 'fail' => 90, 12 ], 13 14 'memory_usage_threshold' => [ 15 'warning' => 75, 16 'fail' => 90, 17 ],
Routes
Now we’re ready to start working on the frontend of the app. Start by replacing the contents of the routes/web.php file with the following. Below, we’re adding two routes: one for handling the request to the home page of the app and the other for handling the POST request for updating the page visibility status:
1<?php 2 Route::get('/', 'MonitorController@index'); // for serving the app dashboard 3 Route::post('/page-visibility', 'MonitorController@updatePageVisibility'); // for updating the page visibility
Monitor Controller The next step is to create the MonitorController that we’ve used above. Execute the following command in the terminal to create it:
php artisan make:controller MonitorController
This will generate an app/Controllers/MonitorController.php file with some minimal boilerplate code for a controller. Clear the contents of the file and add the following instead:
1<?php 2 // app/Controllers/MonitorController.php 3 namespace App\Http\Controllers; 4 5 use Illuminate\Http\Request; 6 use App\Host; 7 use Illuminate\Support\Facades\Cache; 8 9 class MonitorController extends Controller 10 { 11 public function index() 12 { 13 $hosts = Host::get(); 14 return view('monitor', [ 15 'hosts' => $hosts 16 ]); 17 } 18 19 public function updatePageVisibility() 20 { 21 Cache::put('page_visibility', request('state')); 22 return 'ok'; 23 } 24 }
In the code above, we’ve imported the Host model but we haven’t created it yet. This model represents the hosts table in the database. We’re using it to get the list of hosts (remote servers) that are monitored.
Host model The next thing we need to do is create the Host model:
php artisan make:model Host
That will create an app/Host.php file. Replace its contents with the following. Below, we’re adding an Eloquent relationship to the App\Check model. This allows us to get the system checks associated with a specific host:
1<?php 2 // app/Host.php 3 namespace App; 4 5 use Illuminate\Database\Eloquent\Model; 6 7 class Host extends Model 8 { 9 public function checks() 10 { 11 return $this->hasMany('App\Check'); 12 } 13 }
Check model
Since we’ve already referenced the Check model earlier, we now need to create it:
php artisan make:model Check
That’s all there is to it. We don’t really need to make any modifications to the boilerplate code. But in case it changes in the future, here’s what it looks like:
1<?php 2 // app/Check.php 3 namespace App; 4 5 use Illuminate\Database\Eloquent\Model; 6 7 class Check extends Model 8 { 9 10 }
Index page
At this point we’re now ready to add the HTML code. Create a resources/views/monitor.blade.php file and add the following:
1<!DOCTYPE html> 2 <html> 3 <head> 4 <meta charset="utf-8"> 5 <meta name="viewport" content="width=device-width, initial-scale=1"> 6 7 <meta name="csrf-token" content="{{ csrf_token() }}"> 8 9 <title>Live Server Monitor</title> 10 11 <script src="{{ asset('js/app.js') }}" defer></script> 12 13 <link rel="dns-prefetch" href="//fonts.gstatic.com"> 14 <link href="https://fonts.googleapis.com/css?family=Nunito" rel="stylesheet" type="text/css"> 15 16 <link href="{{ asset('css/app.css') }}" rel="stylesheet"> 17 18 </head> 19 <body> 20 <div id="app"> 21 <header> 22 <nav class="navbar navbar-expand-md navbar-light navbar-laravel"> 23 <div class="container"> 24 <a class="navbar-brand" href="{{ url('/') }}">Live Server Monitor</a> 25 </div> 26 </nav> 27 </header> 28 29 <main class="py-4 container"> 30 <div class="row"> 31 32 @forelse ($hosts as $host) 33 <div class="col"> 34 <div class="card" style="width: 18rem;"> 35 <div class="card-body"> 36 <h5 class="card-title">{{ $host->name }}</h5> 37 <h6 class="card-subtitle mb-2 text-muted" id="host-{{ $host->id }}">Last updated: {{ minValue($host->checks) }}</h6> 38 @forelse (onlyEnabled($host->checks) as $check) 39 <ul class="mt-3"> 40 <li id="check-{{ $check->id }}"> 41 {{ $check->type }}: <span class="{{ $check->type }} {{ numberTextClass($check->type, $check->status, $check->last_run_message) }}">{{ $check->last_run_message }}</span> 42 </li> 43 </ul> 44 @empty 45 <p class="card-text">No checks yet</p> 46 @endforelse 47 </div> 48 </div> 49 </div> 50 @empty 51 <p>No hosts yet</p> 52 @endforelse 53 54 </div> 55 </main> 56 </div> 57 58 <script src="{{ asset('js/index.js') }}" defer></script> 59 60 </body> 61 </html>
All we’re doing in the above code is looping through all the $hosts that were supplied by the controller. We’re filtering the checks so that it only returns the one’s which are enabled (enabled=1 in the database) using a helper function (onlyEnabled()) which we’ll be creating shortly. We also have a helper function for outputting a specific class based on the status of the system check. For example, if specific software is running, we want to change the text color to green. If not, then we want it to be red. That’s what the numberTextClass() function does.
Helper functions
Create a helpers.php file inside the app directory and add the following:
1// app/helpers.php 2 function textClass($status, $last_message) { 3 if ($last_message == 'is running') { // change text color based on the last message 4 return ($status == 'success') ? 'text-success' : 'text-danger'; 5 } 6 return ($status == 'failed') ? 'text-danger' : ''; 7 } 8 9 function onlyEnabled($collection) { // filter the collection to only the one's which are enabled 10 return $collection->filter(function($item) { 11 return $item->enabled == 1; 12 }); 13 } 14 15 function minValue($checks) { // used for returning the oldest last_ran_at date 16 return min(array_column($checks->toArray(), 'last_ran_at')); 17 } 18 19 function numberTextClass($type, $status, $text) { // change text color based on the threshold value 20 // these maps to the treshold configs in the config/server-monitor.php` 21 $configs = [ 22 'diskspace' => 'server-monitor.diskspace_percentage_threshold', 23 'cpu' => 'server-monitor.cpu_usage_threshold', 24 'memory' => 'server-monitor.memory_usage_threshold' 25 ]; 26 27 preg_match('/(\d+)/', $text, $pieces); // get all the numbers in the text 28 29 if (!empty($pieces)) { 30 $number = (float) $pieces[0]; 31 $config = config($configs[$type]); 32 return ($number >= $config['fail']) ? 'text-danger' : (($number >= $config['warning']) ? 'text-warning' : ''); // determine the class to add based on the current percentage value 33 } 34 35 return textClass($status, $text); // for the one's whose value isn't percentage based 36 }
Since the class we’ve just added needs to be preloaded on every file, we need to update the composer.json file and tell it to autoload the app/helpers.php file:
1{ 2 // ... 3 "extra": { 4 // ... 5 }, 6 "autoload": { 7 // ... 8 "classmap": [ 9 // ... 10 ], 11 "files": ["app/helpers.php"] // add this 12 }, 13 }
Save the changes then execute the following command to reload the files that need to be autoloaded:
composer dump-autoload
Page scripts At this point, we can now add the JavaScript code for receiving the events from the backend as well as updating the page visibility.
Open the resources/js/bootstrap.js file and uncomment the following lines. This allows us to subscribe to the channel that we’ve broadcasted on in the backend earlier:
1// resources/js/bootstrap.js 2 import Echo from 'laravel-echo' 3 4 window.Pusher = require('pusher-js'); 5 6 window.Echo = new Echo({ 7 broadcaster: 'pusher', 8 key: process.env.MIX_PUSHER_APP_KEY, 9 cluster: process.env.MIX_PUSHER_APP_CLUSTER, 10 encrypted: true 11 });
Next, create a resources/js/index.js file and add the following code. The most important code here is the one where we subscribe to the live-monitor channel. Note that the period before the event name (finished.check) is not a typo. We need to put that to instruct Laravel Echo not to prepend the application's namespace to the event. From there, we just destructure the message and use the different properties of the message object to update the element which displays the data that we need to update:
1// resources/js/index.js 2 // set the CSRF token generated in the page as a header value for all AJAX requests 3 // https://laravel.com/docs/master/csrf 4 $.ajaxSetup({ 5 headers: { 6 'X-CSRF-TOKEN': $('meta[name="csrf-token"]').attr('content') 7 } 8 }); 9 10 window.Visibility = require('visibilityjs'); // import the visibility.js library 11 12 // subscribe to the live-monitor channel and listen to the finished.check event 13 window.Echo.channel('live-monitor') 14 .listen('.finished.check', (e) => { 15 16 const { id, type, last_run_message, element_class, last_update, host_id } = e.message; // destructure the event data 17 18 $(`#${id} .${type}`) 19 .text(last_run_message) 20 .removeClass('text-success text-danger text-warning') 21 .addClass(element_class); 22 23 $(`#${host_id}`).text(`Last update: ${last_update}`); 24 }); 25 26 // next: add code for updating page visibility
Next, add the code for listening to page visibility changes. Make a POST request to update the status in the backend. This effectively stops the notifications from happening if the state value becomes equal to hidden:
1Visibility.change(function (e, state) { 2 $.post('/page-visibility', { state }); // hidden or visible 3 });
Lastly, update the webpack.mix.js file to include the resources/js/index.js file for minification:
1mix.js('resources/js/app.js', 'public/js') 2 .js('resources/js/index.js', 'public/js') // add this 3 .sass('resources/sass/app.scss', 'public/css');
Once that’s added, you can now process the frontend scripts and styles:
npm run dev
Adding a remote server
laravel-server-monitor comes with an Artisan utility for adding a host. Execute the following on the terminal to add one:
php artisan server-monitor:add-host
Here’s what adding a host will look like:
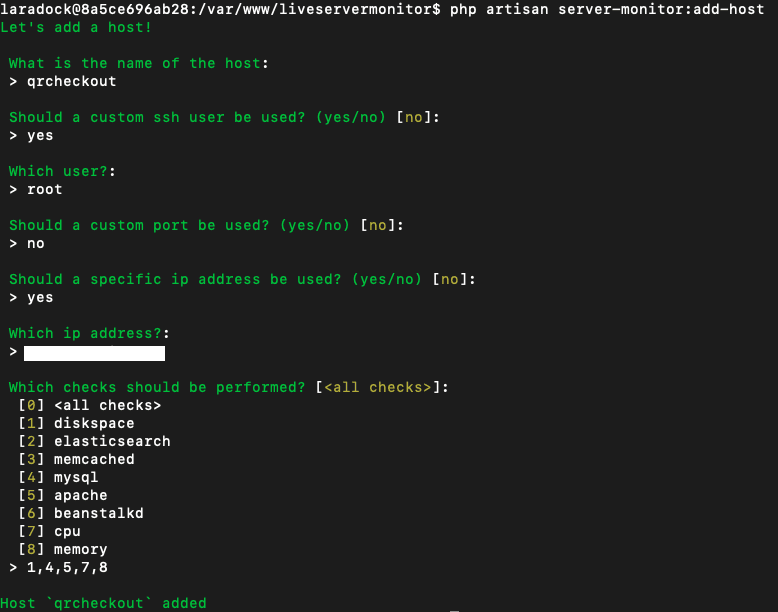
You can also do this manually through the database by adding a new entry to the hosts table and adding the checks that you want to the checks table. You can even create your own Artisan command to customize it based on your needs.
Here’s what the checks table looks like. If at some point, you want to disable a specific check that you’ve previously added, you can simply set enabled to 0 or delete the row entirely:
Running the app
Before running the app, you first need to update the .env file with your Pusher app instance credentials:
1BROADCAST_DRIVER=pusher 2 QUEUE_CONNECTION=sync 3 4 PUSHER_APP_ID=YOUR_PUSHER_APP_ID 5 PUSHER_APP_KEY=YOUR_PUSHER_APP_KEY 6 PUSHER_APP_SECRET=YOUR_PUSHER_APP_SECRET 7 PUSHER_APP_CLUSTER=YOUR_PUSHER_APP_CLUSTER 8 9 MIX_PUSHER_APP_KEY="${PUSHER_APP_KEY}" 10 MIX_PUSHER_APP_CLUSTER="${PUSHER_APP_CLUSTER}"
Once that’s done, access the app on your browser. For me, I used liveservermonitor.loc as the local domain name.
You can manually trigger a system check using the artisan utility provided by laravel-server-monitor:
php artisan server-monitor:run-checks
Do note that you have to uncomment the line which checks for page visibility in the app/Channels/PusherChannelsChannel.php file for it to work. It wouldn’t really trigger the event if the page is not currently in the foreground:
1if (Cache::get('page_visibility') == 'visible') { 2 // ... 3 }
Running system checks
The ideal way for us to run the checks is to run them at a specific interval. Laravel already comes with Task Scheduling features. This allows us to run the php artisan server-monitor:run-checks command at a specific interval.
Open the app/Console/Kernel.php file and add the following inside the schedule() function. This will automatically run the command every minute:
1protected function schedule(Schedule $schedule) 2 { 3 $schedule->command('server-monitor:run-checks')->everyMinute(); // add this 4 }
This makes use of crontab so you’ll have to enable it by adding the following to your cron entry file (crontab -e):
* * * * * cd /path-to-your-project && php artisan schedule:run >> /dev/null 2>&1
At this point, you should now be able to access the app’s dashboard page and the data displayed would refresh every minute.
Conclusion
That’s it! In this tutorial, we’ve built a web app for monitoring the status of your servers in realtime. We’ve used the Laravel Server Monitor package by Spatie to implement most of the functionality. Then we used Pusher Channels to update the server status displayed on the screen in realtime. Lastly, we used the Visibility.js library to check if a user is currently viewing the page where the server status is displayed.
With this knowledge, you’ll now be able to add your own server checks to constantly monitor your servers during times where you expect more traffic than usual. You can also add custom notifications and have the server send you a text message when the CPU usage goes above the threshold that you’ve set.
You can view the full source code of the app on this GitHub repo.