- Products

- Developers
- User stories
- Blog
- Pricing

Create a live graph with Go
Introduction
An astronomical number of data streams are being generated every day because data is core to diverse systems. Today’s business owners have come to recognize data as an important factor during decision making.
However, the gathered bulk data would be confusing to read and useless without a way to visualize it. For this reason, realtime monitoring systems have gained popularity over the years. We can use such systems to visualize website traffic, weather updates, server performance and so on.
In this article, we will build a realtime monitoring graph that continuously displays updates on website traffic after a fixed interval. We will build a Go backend server that exposes several endpoints and uses Pusher Channels to trigger events on the count of user visits. We will simulate the website traffic data using a simple setInterval function and a pseudorandom number generator.
On the frontend, we will receive the simulated updates from Pusher and render the data trend using a line chart. The graph will be a plot on “user visits” against “total number of pages visited.” For context, here is a sample of what we will be building:
From the image above, we can see that there is a button labeled Simulate user visits, this button is responsible for starting the simulator on the Backend server. Let’s begin.
Requirements
To follow along with this article, you will need the following:
- An editor like Visual Studio Code.
- Go (version >= 1.10.x) installed on your computer. Heres how you can install Go.
- Basic knowledge of the Go programming language.
- Basic knowledge of JavaScript (ES6).
- Pusher account. Create a free sandbox Pusher account or sign in.
Once you have all the above requirements, we can proceed.
Setting up Pusher
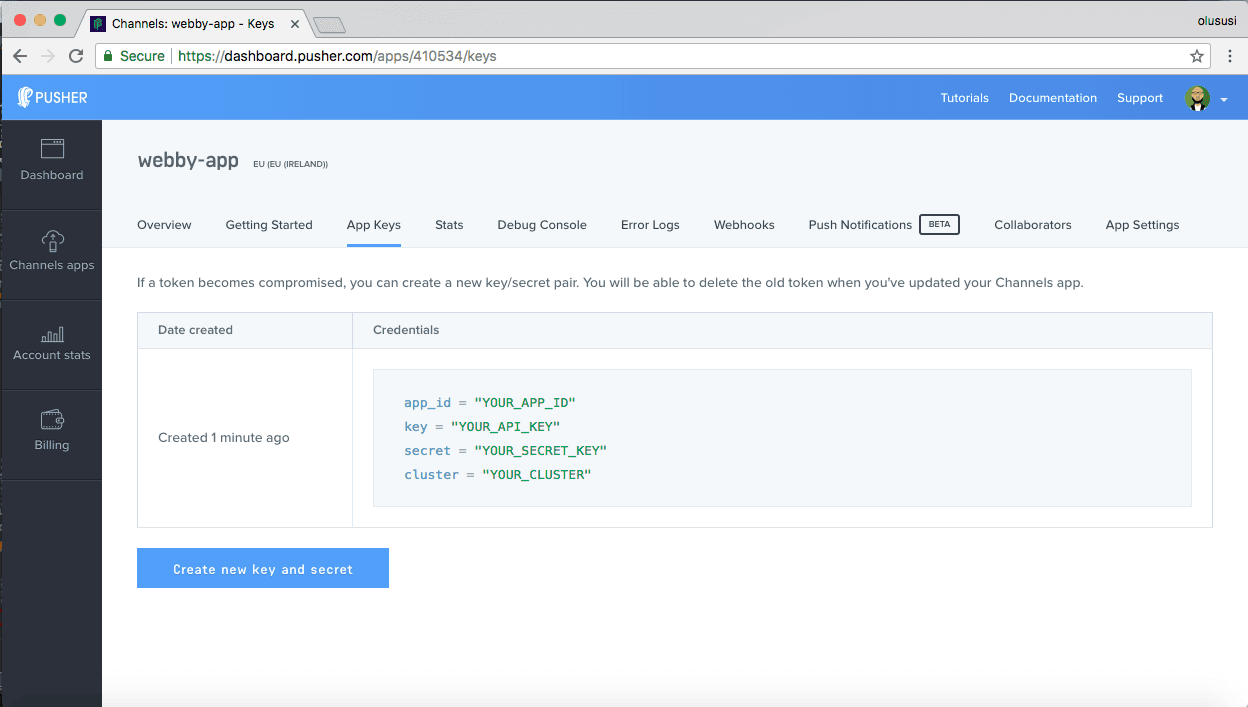
To get started, go to the Pusher dashboard and create a Channels app. We will need the application credentials for our realtime features to work. Follow the application creation wizard and then you should be given your application credentials, we will use this later in the article.
Setting up the codebase
Let’s begin by navigating into the src directory that is located in the $GOPATH and creating a new directory for our app. This will be our working directory:
1$ cd $GOPATH/src 2 $ mkdir pusher-go-realtime-graph 3 $ cd pusher-go-realtime-graph
Create a new file called graph.go. Now, before adding content to this file, we need to install the Go packages that we will be referencing within our application.
Run the following packages to pull in the packages:
1$ go get github.com/labstack/echo 2 $ go get github.com/labstack/echo/middleware 3 $ go get github.com/pusher/pusher-http-go
IMPORTANT: If you use Windows and you encounter the error ‘cc.exe: sorry, unimplemented: 64-bit mode not compiled in ‘, then you need a Windows gcc port, such as https://sourceforge.net/projects/mingw-w64/. Also, see this GitHub issue.
Within your favorite editor, open the graph.go file and update it with the following code:
1package main 2 3 import ( 4 "math/rand" 5 "net/http" 6 "time" 7 "github.com/labstack/echo" 8 "github.com/labstack/echo/middleware" 9 pusher "github.com/pusher/pusher-http-go" 10 ) 11 12 // We register the Pusher client 13 var client = pusher.Client{ 14 AppId: "PUSHER_APP_ID", 15 Key: "PUSHER_APP_KEY", 16 Secret: "PUSHER_APP_SECRET", 17 Cluster: "PUSHER_APP_CLUSTER", 18 Secure: true, 19 } 20 21 // visitsData is a struct 22 type visitsData struct { 23 Pages int 24 Count int 25 } 26 27 func main() { 28 // Echo instance 29 e := echo.New() 30 31 // Middleware 32 e.Use(middleware.Logger()) 33 e.Use(middleware.Recover()) 34 35 // Define the HTTP routes 36 e.File("/", "public/index.html") 37 e.File("/style.css", "public/style.css") 38 e.File("/app.js", "public/app.js") 39 e.GET("/simulate", simulate) 40 41 // Start server 42 e.Logger.Fatal(e.Start(":9000")) 43 }
The graph.go file is the main entry point of our backend server so this is where we import all the packages we previously pulled in. We import the time package because we will need it to create a new ticker for our custom setInterval function. We import the math/rand package because it provides the pseudorandom number generation.
Next, registered a new Pusher client with the credentials from the app we created earlier.
IMPORTANT: Replace
PUSHER_*keys with your app credentials.
We also created a visitsData type, which is a struct with two fields:
Pages- this is the number of pages visited at a given timeCount- this is the user count at a given time
We defined the main function (this is where the application starts its execution) and created a new echo instance.
In this application, because we will serve the static files that define our frontend from the backend server, we need to let Go know about them and their location. In the main function, we registered the routes that will serve these static files that we will create shortly.
We also defined a “/simulate” route that takes a simulate handler function and responds to the GET HTTP verb. Lastly, we instruct the echo instance we created to start the application and listen on the port 9000.
Let’s create the simulate function, before the start of the main function paste the following code:
1// [...] 2 3 // ------------------------------------------------------- 4 // Simulate multiple changes to the visitor count value, 5 // this way the chart will always update with different 6 // values. 7 // ------------------------------------------------------- 8 9 func simulate(c echo.Context) error { 10 setInterval(func() { 11 s1 := rand.NewSource(time.Now().UnixNano()) 12 r1 := rand.New(s1) 13 newVisitsData := visitsData{ 14 Pages: r1.Intn(100), 15 Count: r1.Intn(100), 16 } 17 client.Trigger("visitorsCount", "addNumber", newVisitsData) 18 }, 2500, true) 19 20 return c.String(http.StatusOK, "Simulation begun") 21 } 22 23 // [...]
Within the simulate function, we called a setInterval function and within it we seeded a new random number using the time.Now() function. We also instantiated a new visitsData object with the name newVisitsData and initialized both the Pages and Count fields using randomly generated numbers. We set the interval between running the logic to 2500ms.
Lastly, we use the Trigger method on the client object to broadcast an addNumber event over the visitorsCount channel.
Let’s create the setInterval function before the simulate function paste the following code:
1func setInterval(ourFunc func(), milliseconds int, async bool) chan bool { 2 3 // How often to fire the passed in function in milliseconds 4 interval := time.Duration(milliseconds) * time.Millisecond 5 6 // Setup the ticker and the channel to signal 7 // the ending of the interval 8 ticker := time.NewTicker(interval) 9 clear := make(chan bool) 10 11 // Put the selection in a go routine so that the for loop is none blocking 12 go func() { 13 for { 14 select { 15 case <-ticker.C: 16 if async { 17 // This won't block 18 go ourFunc() 19 } else { 20 // This will block 21 ourFunc() 22 } 23 case <-clear: 24 ticker.Stop() 25 return 26 } 27 } 28 }() 29 30 // We return the channel so we can pass in 31 // a value to it to clear the interval 32 return clear 33 }
Using Goroutines and Channels, we have created a setInterval function that works like the one in JavaScript. For its parameters, it receives the function to be called after an interval, the interval and a boolean value that determines if it runs asynchronously or not.
Building the frontend
In this step, we will use the received data from the backend server to represent a mathematical graph. To achieve this, we can use any of the open source libraries that support chart types, such as bar charts, pie charts, line charts and scatter charts. Here are links to a few of the popular libraries:
In this tutorial, we will use Chart.js; it has a fairly simple API and renders robust charts using the HTML canvas tag. It is also able to update the chart without completely re-rendering it and this is what we need since we will be rendering Pusher updates.
To start building the frontend of our application, we will create a public folder in our working directory and create three files within it:
1$ mkdir public 2 $ cd public 3 $ touch index.html style.css app.js
Open the index.html file and update it with the following code:
1<!DOCTYPE> 2 <html> 3 <head> 4 <title>Realtime User Analytics</title> 5 <link rel="stylesheet" href="https://fonts.googleapis.com/css?family=Raleway:200"> 6 <link rel="stylesheet" href="./style.css"> 7 <link rel="stylesheet" href="https://maxcdn.bootstrapcdn.com/bootstrap/4.0.0-beta.2/css/bootstrap.min.css" integrity="sha384-PsH8R72JQ3SOdhVi3uxftmaW6Vc51MKb0q5P2rRUpPvrszuE4W1povHYgTpBfshb" crossorigin="anonymous"> 8 <meta name="viewport" content="width=device-width, initial-scale=1.0"> 9 </head> 10 11 <body> 12 13 <section class="subheader"> 14 <h2>Realtime User Traffic Analytics</h2> 15 <button id="getUpdates" class="btn-primary"> Simulate user visits</button> 16 </section> 17 18 <section width="500px" style="margin:0 auto;width: 100%;max-width: 800px"> 19 <canvas id="realtimeChart"></canvas> 20 </section> 21 22 <script src="https://cdnjs.cloudflare.com/ajax/libs/Chart.js/2.5.0/Chart.bundle.min.js"></script> 23 <script src="https://js.pusher.com/4.0/pusher.min.js"></script> 24 <script src="https://unpkg.com/axios/dist/axios.min.js"></script> 25 <script type="text/javascript" src="./app.js"></script> 26 27 </body> 28 </html>
In the scripts part of the markup above, we pulled in the JavaScript Pusher library, Axios, and Chart.js.
In order to style our app properly, add the following CSS into the style.css file the public folder:
1body{ 2 margin:0; 3 padding:0; 4 font-family: Raleway; 5 } 6 7 header{ 8 background: #2b303b; 9 height: 50px; 10 width:100%; 11 display: flex; 12 color:#fff; 13 } 14 15 .subheader{ 16 margin: 20px; 17 text-align: center; 18 }
Displaying realtime graph updates using Pusher
In this section, we will write the vanilla JavaScript code that will receive updates from Pusher and update the graph accordingly. We will achieve this behavior by subscribing to the unique channel where our server will be sending update events for the graph. The name of this channel is visitorsCount and the event we will be binding to is called addNumber.
Because we want to control when the realtime updates start, we will use JavaScript to target the button element — simulate user visits — in the markup and attach an eventListener, so that the updates only start coming in when we click the button. When the button is clicked, our frontend will make a GET request, using Axios, to the “/simulate” endpoint on our backend server and the realtime updates will start.
We will also instantiate a new line chart object passed in a chartConfig object as an argument, this chartConfig object will supply the data that will define the line chart’s properties.
Open the app.js file and update it with the following code:
1document.getElementById("getUpdates").addEventListener("click", function(){ 2 axios.get('/simulate') 3 }) 4 5 const pusher = new Pusher('PUSHER_APP_KEY', { 6 cluster: 'PUSHER_APP_CLUSTER', 7 encrypted: true 8 }); 9 10 const channel = pusher.subscribe('visitorsCount'); 11 12 channel.bind('addNumber', data => { 13 if (newLineChart.data.labels.length > 15) { 14 newLineChart.data.labels.shift(); 15 newLineChart.data.datasets[0].data.shift(); 16 } 17 18 newLineChart.data.labels.push(data.Count); 19 newLineChart.data.datasets[0].data.push(data.Pages); 20 newLineChart.update(); 21 }); 22 23 function renderChart(userVisitsData) { 24 var ctx = document.getElementById("realtimeChart").getContext("2d"); 25 26 var options = {}; 27 28 newLineChart = new Chart(ctx, { 29 type: "line", 30 data: userVisitsData, 31 options: options 32 }); 33 } 34 35 var chartConfig = { 36 labels: [], 37 datasets: [ 38 { 39 label: "Realtime User Analytics", 40 fill: false, 41 lineTension: 0.1, 42 backgroundColor: "rgba(75,192,192,0.4)", 43 borderColor: "rgba(75,192,192,1)", 44 borderCapStyle: 'butt', 45 borderDash: [], 46 borderDashOffset: 0.0, 47 borderJoinStyle: 'miter', 48 pointBorderColor: "rgba(75,192,192,1)", 49 pointBackgroundColor: "#fff", 50 pointBorderWidth: 1, 51 pointHoverRadius: 5, 52 pointHoverBackgroundColor: "rgba(75,192,192,1)", 53 pointHoverBorderColor: "rgba(220,220,220,1)", 54 pointHoverBorderWidth: 2, 55 pointRadius: 1, 56 pointHitRadius: 10, 57 data: [], 58 spanGaps: false, 59 } 60 ] 61 }; 62 63 renderChart(chartConfig)
IMPORTANT: Replace
PUSHER_APP_*keys with your app credentials.
Running the application
We can run our application with this command:
$ go run graph.go
We can now point our web browser to this address http://localhost:9000, at first, the graph in the window will be static but after we click on the Simulate users visit button, we will see this the realtime updates:
Conclusion
In this article, we have discussed the importance of data in today’s tech world and gone over the process of building a realtime monitoring system using Go and Pusher channels. In addition to that, we used Vanilla JavaScript to build the frontend of our application and hit an endpoint on our Go web server using Axios.
The source code to the application is available on GitHub.


© 2026 Pusher Ltd. All rights reserved.
Pusher Limited is a company registered in England and Wales (No. 07489873) whose registered office is at MessageBird UK Limited, 3 More London Riverside, 4th Floor, London, United Kingdom, SE1 2AQ.