- Products

- Developers
- User stories
- Blog
- Pricing

Build a live graph with Ember.js
Introduction
Introduction
In this post, we will build a simple interactive graph with Ember.js. With this, a user can have a better understanding of the data by hovering on a point and seeing more information using the hovering facility as depicted in the image below:
Prerequisites
It is important that you have Node.js and npm installed on your machine. Learn how to install Node.js and npm here. A quick run-down of the core technologies we will be using include:
- Ember.js: an open source JavaScript web framework for creating scalable single-page web applications.
- Pusher: a Node.js client to interact with the Pusher REST API. Sign up for a free Pusher account.
- Express: Node utility for handling HTTP requests via routes.
Getting started
To get started with an Ember application, it is recommended to use Ember CLI tool as this will enable you to conveniently craft a new app with a single command. You can install it with npm, open your terminal and type this command:
npm install -g ember-cli
The Ember CLI will give us access to the ember command that will be used to set up our project easily.
Creating the application
We now have access to the ember new command that can be used to create our application. Open up the terminal on your machine and run a command that will create an application named ember-realtime-graph in your project directory:
ember new ember-realtime-graph
Next, change directory into the newly created project and start the development server:
1// change directory 2 cd ember-realtime-graph 3 4 // start the development server 5 ember serve
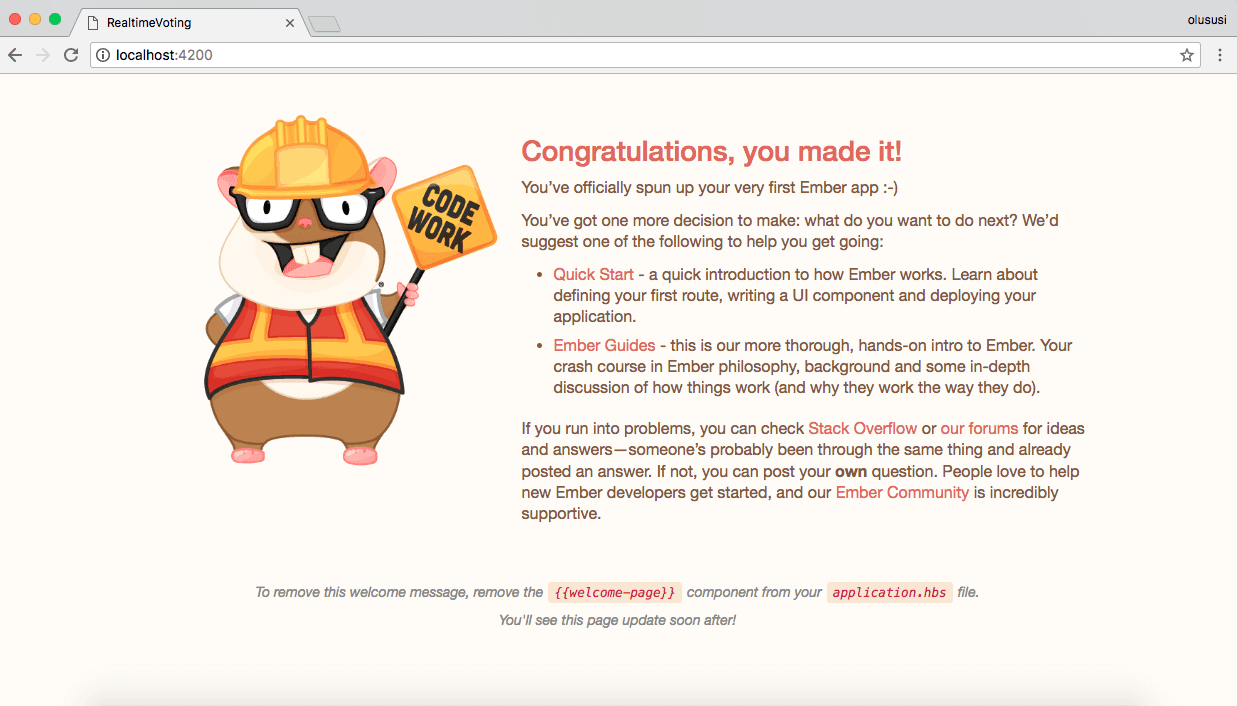
This will start the development server on http://localhost:4200. Open your favorite browser and navigate to that URL, you should see a default welcome page by Ember.js as shown below:
Install server dependencies
Run the following command to install the dependencies required for this project using:
1npm install --save pusher pusher-js chart.js 2 npm install --save dotenv express 3 ember install ember-browserify
Set up Pusher Channels
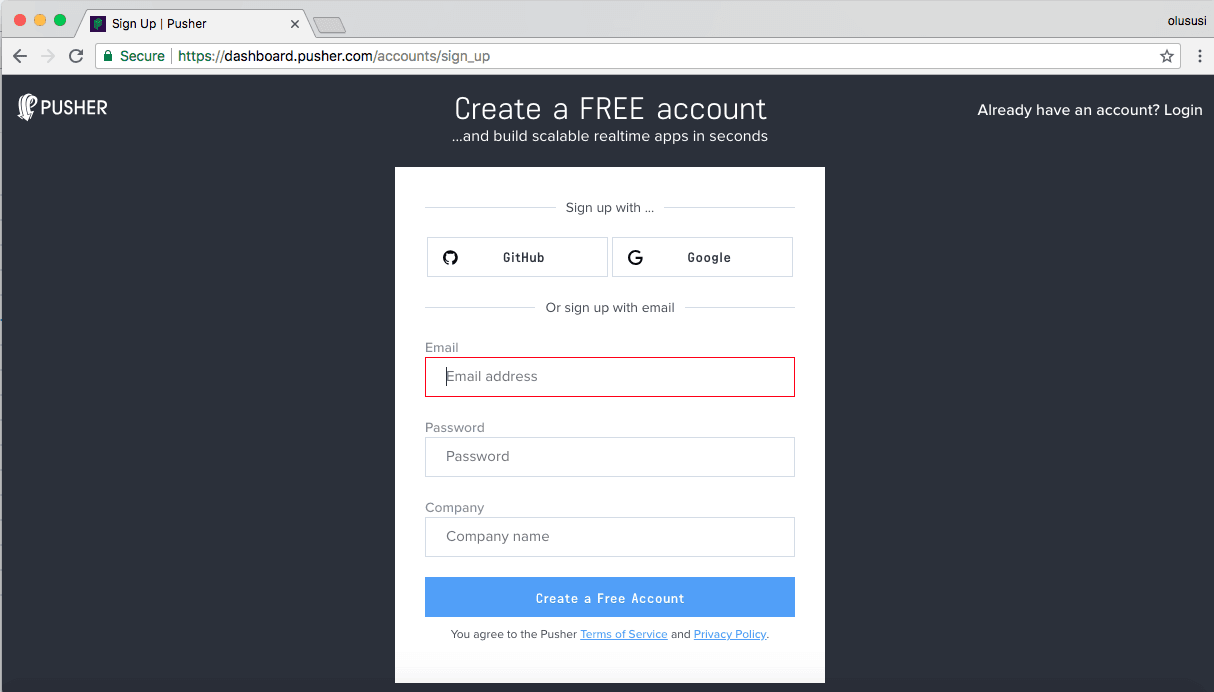
To get started with Pusher Channels, sign up for a free Pusher account. Then go to the dashboard and create a new Channels app.
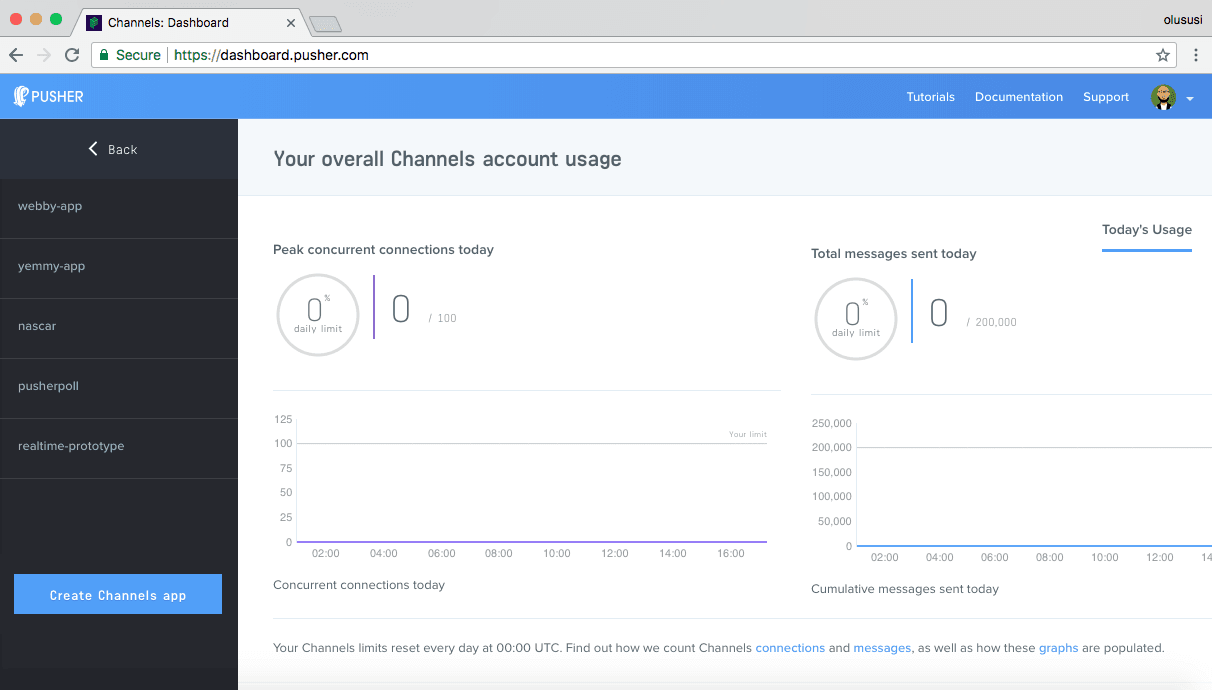
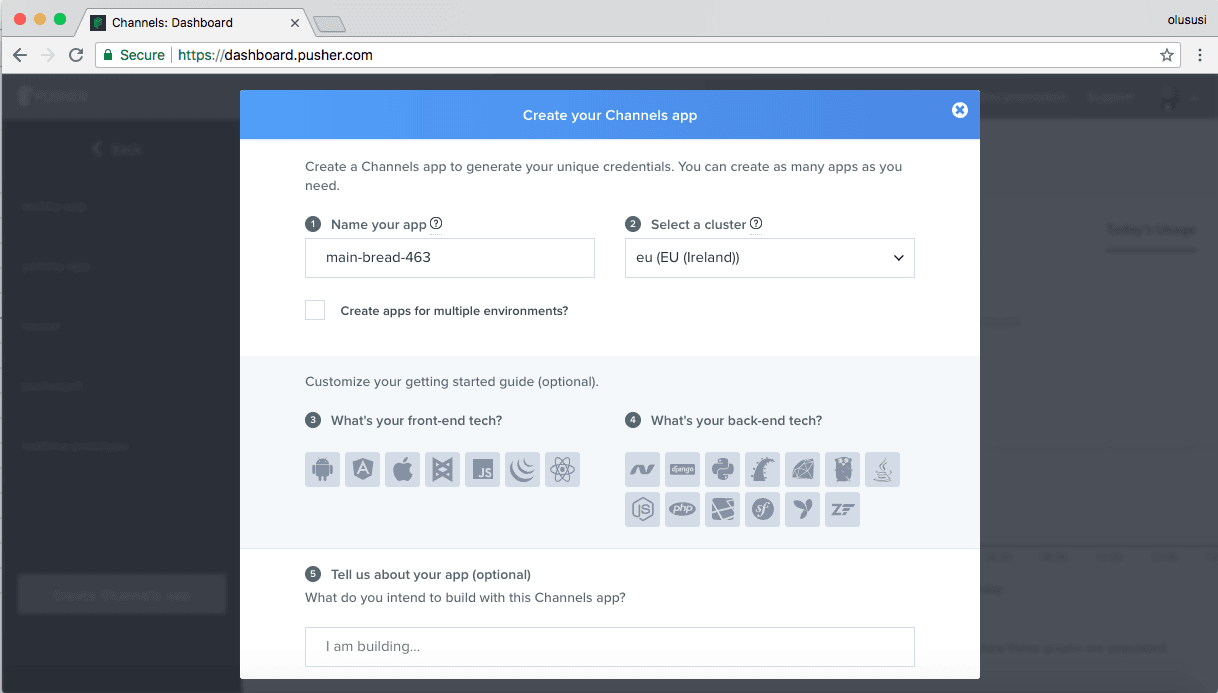
Create a new app by selecting Channels apps on the sidebar and clicking Create Channels app button on the bottom of the sidebar:
Configure an app by providing basic information requested in the form presented. You can also choose the environment you intend to integrate Pusher with to be provided with some boilerplate code:
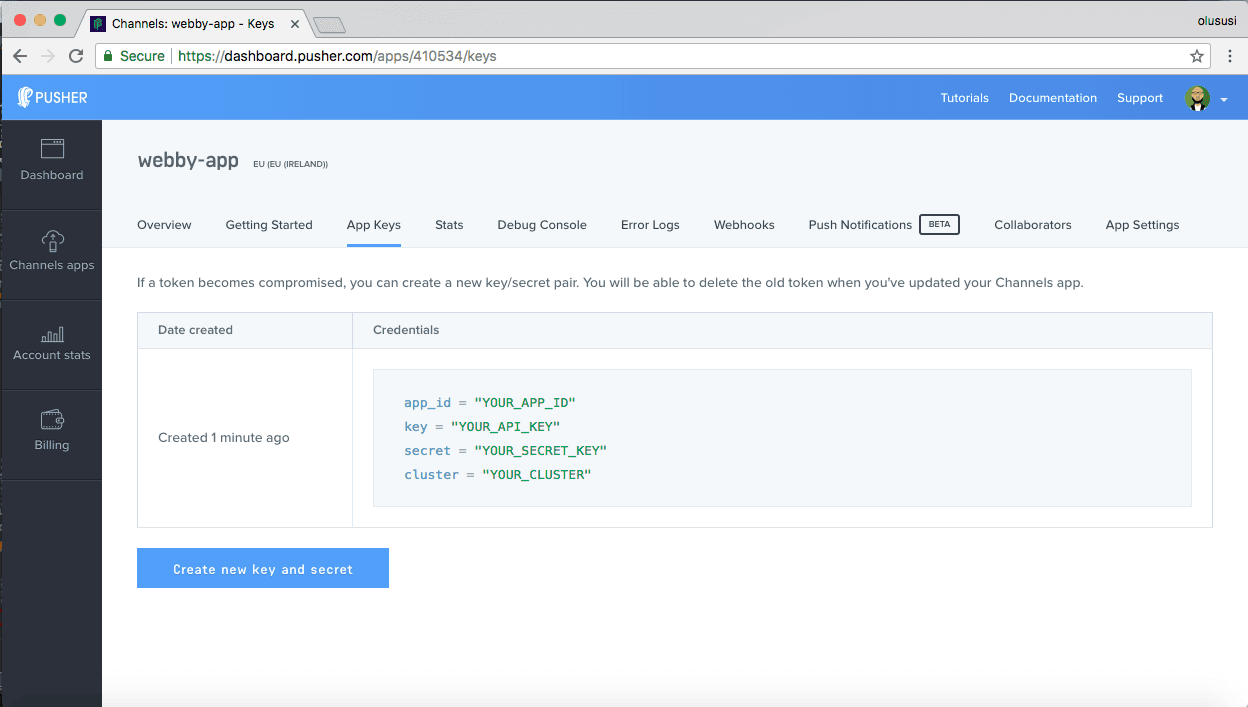
You can retrieve your keys from the App Keys tab:
Setting the environment variables
Create a .env file in the root directory of your application and add your application credentials as obtained from your Pusher dashboard as follows:
1PUSHER_APP_ID=YOUR_APP_ID 2 PUSHER_APP_KEY=YOUR_APP_KEY 3 PUSHER_APP_SECRET=YOUR_APP_SECRET_KEY 4 PUSHER_APP_CLUSTER=CLUSTER
We will make use of the variables specified in the above snippet later in our project. Ensure that you replace YOUR_APP_ID, YOUR_APP_KEY, YOUR_APP_SECRET_KEY and CLUSTER placeholders with the appropriate credentials.
Setting up the server
To properly demonstrate realtime update of our graph, we’ll make use of an existing dummy data of stock trades and price variations. For our Ember application to keep receiving this data at a specified regular interval, let’s quickly set up a simple server.
Create an app.js file in the root directory of your application and add the following code snippet to it to set up the server:
````javascript
// app.js
1const express = require('express'); 2 const Pusher = require('pusher'); 3 require('dotenv').config(); 4 const stockData = require('./stock.json') 5 6 const app = express(); 7 8 const pusher = new Pusher({ 9 appId: process.env.PUSHER_APP_ID, 10 key: process.env.PUSHER_APP_KEY, 11 secret: process.env.PUSHER_APP_SECRET, 12 cluster: process.env.PUSHER_APP_CLUSTER, 13 encrypted: true 14 }); 15 16 let i = 0; 17 setInterval( () => { 18 const GOOG = stockData[1]['Trades'][i]; 19 pusher.trigger('trade', 'stock', GOOG) 20 i++ 21 }, 2000); 22 23 app.set('port', process.env.PORT || 3000); 24 app.listen(app.get('port'), () => { 25 console.log("Listening on port " + app.get('port')); 26 })
1We loaded the required middlewares for the Express server and then imported dummy data for stock trades. You can download this data [here](https://github.com/yemiwebby/ember-realtime-graph/blob/master/stock.json). Once you are done, create a new file named `stock.json` in the root directory of the application and save the downloaded content in it. 2 3Next, we configured Pusher using the credentials we added to our environment variables earlier. And finally, to allow our client receive realtime payloads, we emitted the `stockData` payload on every 2 seconds for our client to subscribe to. 4 5Open another terminal and run the command below to start the server on http://localhost:3000:
node app.js
1This will log a message to the console as shown by the image below: 2 3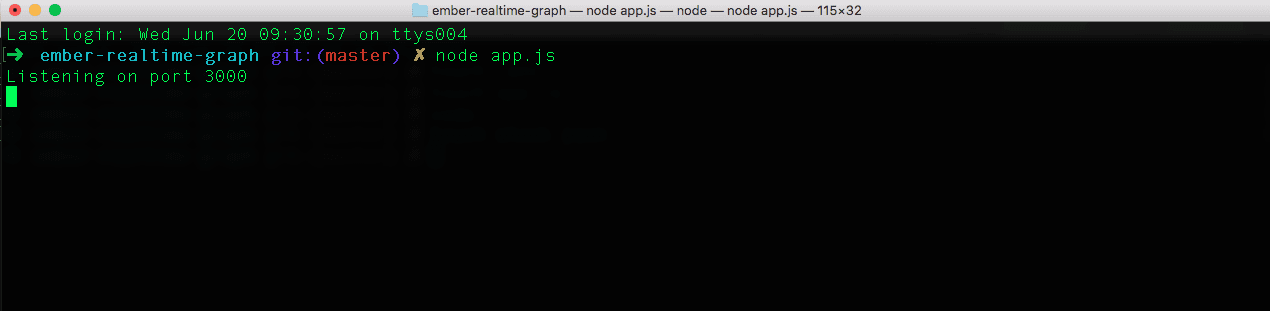 4 5## Generate the chart component 6 7Ember supports the usage and sharing of UI elements on multiple pages. So, we’ll use the component approach and generate one for our application. 8 9Run the command below:
ember generate component realtime-graph
1The command above will generate a JavaScript component file `./app/components/realtime-graph.js` and a Handlebars template that defines the markup for the component’s UI. 2 3 4## Initialize the chart 5 6Next, we’ll initialize the chart to display the stock data to users in realtime. Open the newly generated `./app/components/realtime-graph.js` and update it with: 7 8``` javascript 9 // ./app/components/realtime-graph.js 10 11 import Component from '@ember/component'; 12 import Pusher from 'npm:pusher-js'; 13 import Chart from 'npm:chart.js'; 14 15 export default Component.extend({ 16 init() { 17 this._super(...arguments); 18 19 var chart; 20 initializeChart(); 21 22 function initializeChart() { 23 var ctx = document.getElementById('chart').getContext('2d'); 24 const data = { 25 labels: [], 26 datasets: [{ 27 label: "My First dataset", 28 backgroundColor: 'rgb(255, 99, 132)', 29 borderColor: 'rgb(255, 99, 132)', 30 fill: false, 31 data: [], 32 }] 33 }; 34 chart = new Chart(ctx, { 35 type: 'line', 36 data: data, 37 options: { 38 responsive: true, 39 title: { 40 display: true, 41 text: 'Chart.js Line Chart' 42 }, 43 tooltips: { 44 mode: 'index', 45 intersect: false 46 }, 47 hover: { 48 mode: 'nearest', 49 intersect: true 50 }, 51 scales: { 52 xAxes: [ 53 { 54 display: true, 55 scaleLabel: { 56 display: true, 57 labelString: 'Time ' 58 } 59 } 60 ], 61 yAxes: [ 62 { 63 display: true, 64 scaleLabel: { 65 display: true, 66 labelString: 'Price' 67 }, 68 ticks: { 69 min: 504, 70 max: 507 71 } 72 } 73 ] 74 } 75 } 76 }) 77 } 78 // we will update the chart here 79 } 80 });
The essence of what we executed here is to initialize the chart with a method named intializeChart(). We used it to define a chart and described the kind of data that it should expect, the label, including the colors. We’ll update it with data later in the tutorial.
Update the app template
Update the application template to get rid of the default welcome page and show our chart in its place. Open the ./app/templates/application.hbs file and paste the code below in it:
1{{!-- ./app/templates/application.hbs --}} 2 3 <canvas id="chart"></canvas> 4 {{#realtime-graph}}{{/realtime-graph}} 5 {{outlet}}
Now if you stop the Ember development server by typing Ctrl + c in the terminal and restart it with ember serve, you will see a blank graph as shown in the image below:
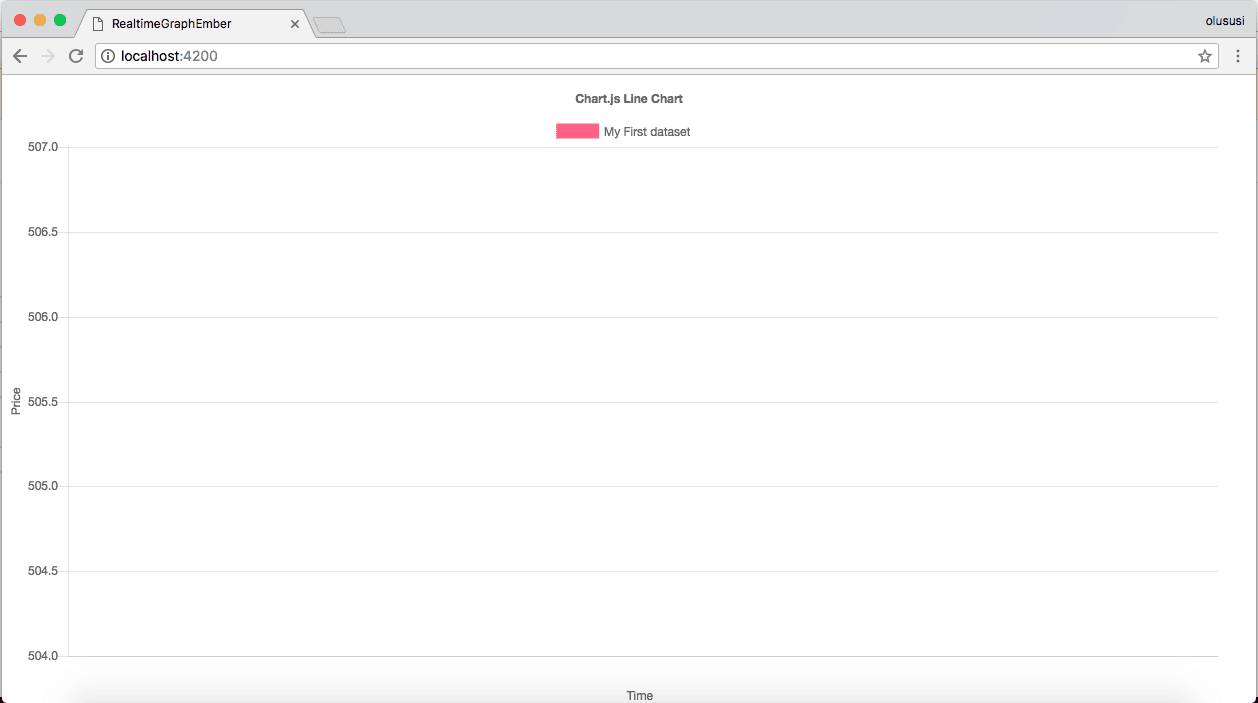
This is because we have not started updating our graph with the data sent in from the server. We’ll change that in the next section.
Update the chart
Our graph requires constant data from the server in order to be displayed. Open ./app/components/realtime-graph.js and add the code below immediately after the initializeChart() method:
1// ./app/components/realtime-graph.js 2 3 import Component from '@ember/component'; 4 import Pusher from 'npm:pusher-js'; 5 export default Component.extend({ 6 7 init() { 8 ... 9 10 const pusher = new Pusher('YOUR_APP_KEY', { // update your APP_KEY 11 cluster: 'CLUSTER', 12 encrypted: true 13 }) 14 15 const channel = pusher.subscribe('trade'); 16 channel.bind('stock', data => { 17 chart.data.labels.push(data.Timestamp.split(' ')[1].split('.')[0]); 18 chart.data.datasets[0].data.push(data.Price); 19 chart.update(); 20 }) 21 } 22 });
Here, we initialized Pusher and subscribed to the trade channel in order to update the chart every single time data comes in from the server. Do not forget to replace the YOUR_APP_KEY and CLUSTER placeholder with the appropriate credentials.
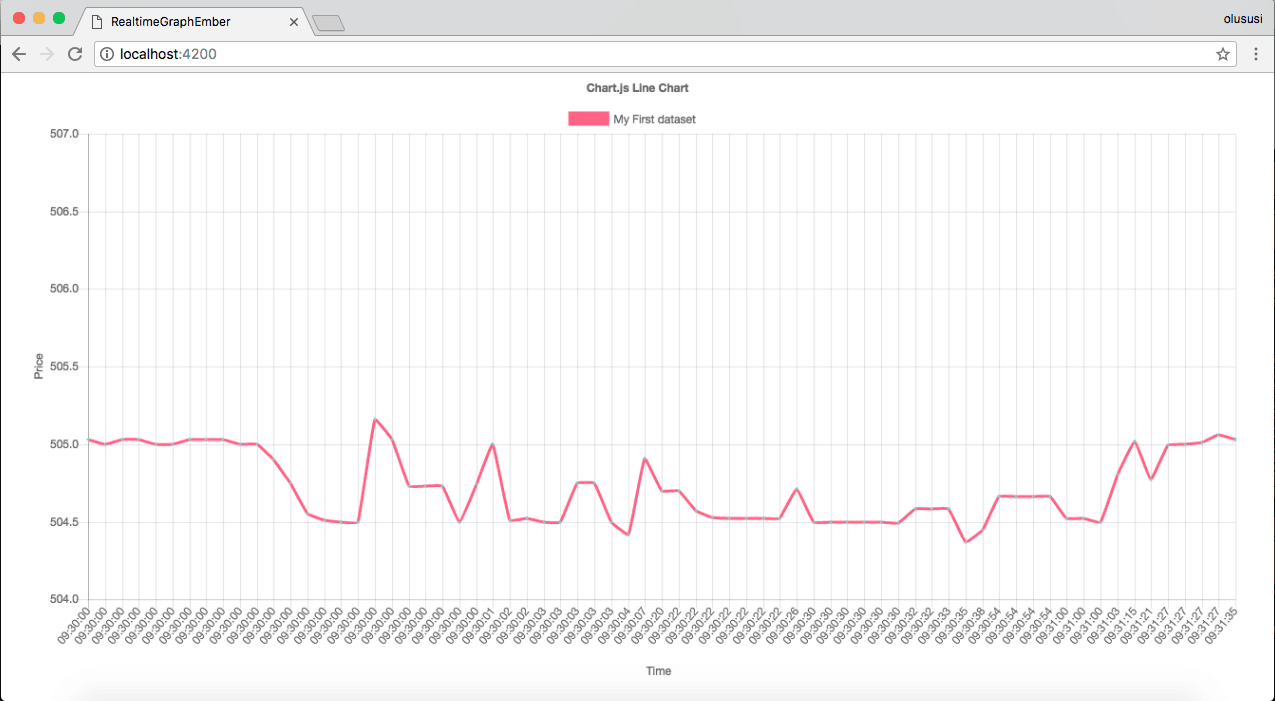
Testing the application
Stop the Ember development server if it is currently running by typing Ctrl + C in the terminal and restart it with ember serve. In addition, don’t forget to also run node app.js from another terminal to start the server in case you haven’t done that. Next, open http://localhost:4200 to test the application.
Conclusion
Interactivity becomes more powerful when you allow users to select points or series in a chart and have a summary of the relevant data appears for them to see. This helps to improve clean looking visualizations of data on a chart. You can easily build similar applications by using any charting tool of your choice.
The complete source code can be found on GitHub.


© 2026 Pusher Ltd. All rights reserved.
Pusher Limited is a company registered in England and Wales (No. 07489873) whose registered office is at MessageBird UK Limited, 3 More London Riverside, 4th Floor, London, United Kingdom, SE1 2AQ.