- Products

- Developers
- User stories
- Blog
- Pricing

Build a realtime graph in Android
Introduction
Despite the hype of serverless architectures and microservices, there are still a lot of applications deployed in servers that need to be managed, and one important part of this task is monitoring resources like CPU, memory, or disk space.
There are a lot of commercial and open source tools for monitoring servers, but what if you just need something simple and specific? Maybe something that can easily show in realtime if things are doing fine, and that you can check on your phone.
In this tutorial, we'll set up a Node.js process to calculate the memory usage of the system at specified intervals, send this information to a Pusher channel, and show it as a graph in an Android app.
This is how the final app will look:
Setting up your Pusher application
Create a free account at https://pusher.com/signup.
When you create an app, you'll be asked to enter some configuration options:
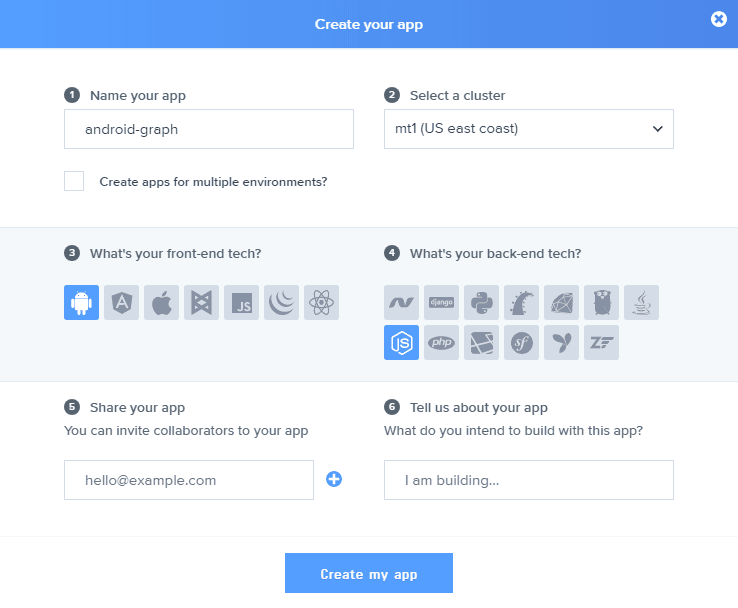
Enter a name, choose Android as your front-end tech, and Node.js as the back-end tech. This will give you some sample code to get you started:
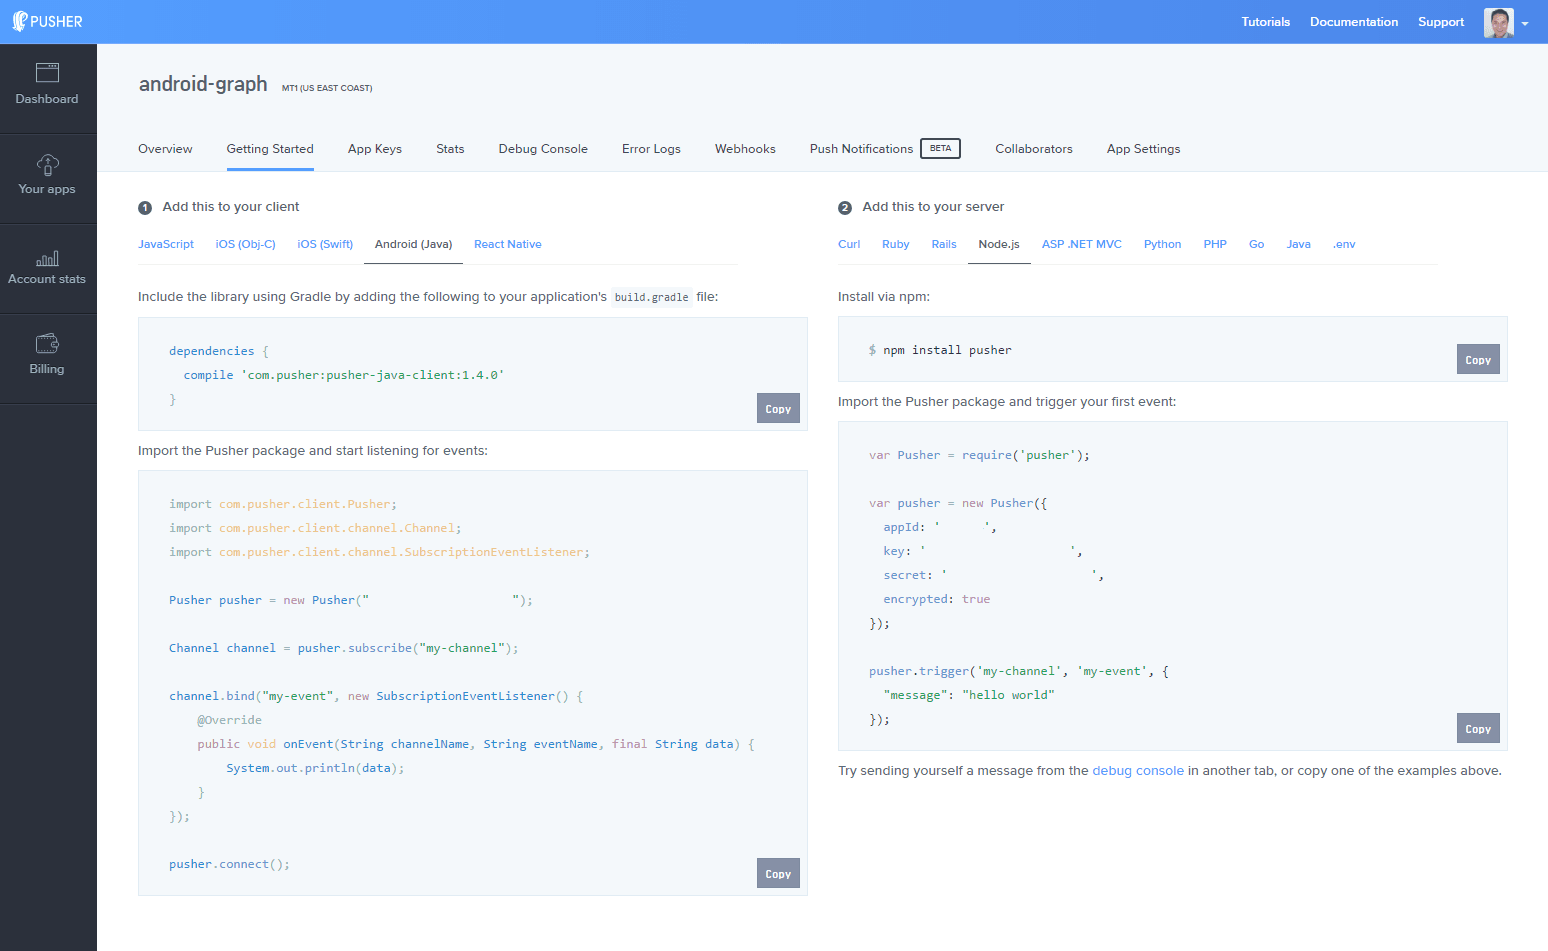
But don't worry, this won't lock you into this specific set of technologies as you can always change them. With Pusher, you can use any combination of libraries.
Next, copy your cluster ID (next to the app title, in this example mt1), App ID, Key, and Secret information, we'll need them next. You can also find them in the App Keys tab.
The Node process
In Node.js, the os module provides a number of operating system-related utility methods.
After requiring the module:
const os = require('os');
We can use the totalmem() function to get the total amount of system memory in bytes and freemem() to get the amount of free system memory, also in bytes.
This way, we use the setInterval function to get the memory information every ten seconds, for example, calculate the used memory, and publish it to a Pusher channel:
1const os = require('os'); 2const Pusher = require('pusher'); 3 4// Set up Pusher 5const pusher = new Pusher({ 6 appId: '<INSERT_PUSHER_APP_ID>', 7 key: '<INSERT_PUSHER_APP_KEY>', 8 secret: '<INSERT_PUSHER_APP_SECRET>', 9 cluster: '<INSERT_PUSHER_APP_CLUSTER>', 10 encrypted: true, 11}); 12 13// To convert from bytes to gigabytes 14const bytesToGigaBytes = 1024 * 1024 * 1024; 15// To specify the interval (in milliseconds) 16const intervalInMs = 10000; 17 18setInterval(() => { 19 const totalMemGb = os.totalmem()/bytesToGigaBytes; 20 const freeMemGb = os.freemem()/bytesToGigaBytes; 21 const usedMemGb = totalMemGb - freeMemGb; 22 23 console.log(`Total: ${totalMemGb}`); 24 console.log(`Free: ${freeMemGb}`); 25 console.log(`Used: ${usedMemGb}`); 26 27 // To publish to the channel 'stats' the event 'new_memory_stat' 28 pusher.trigger('stats', 'new_memory_stat', { 29 memory: usedMemGb, 30 }); 31}, intervalInMs);
Save this to a file, for example memory.js, create a package.json file if you haven't already with:
npm init -y
Install the Pusher dependency with:
npm install --save pusher
And execute it with the command:
node memory.js
You should get the memory information printed in your console. Also, if you go to the Debug Console section of your app in the Pusher dashboard, you should see the events coming up:
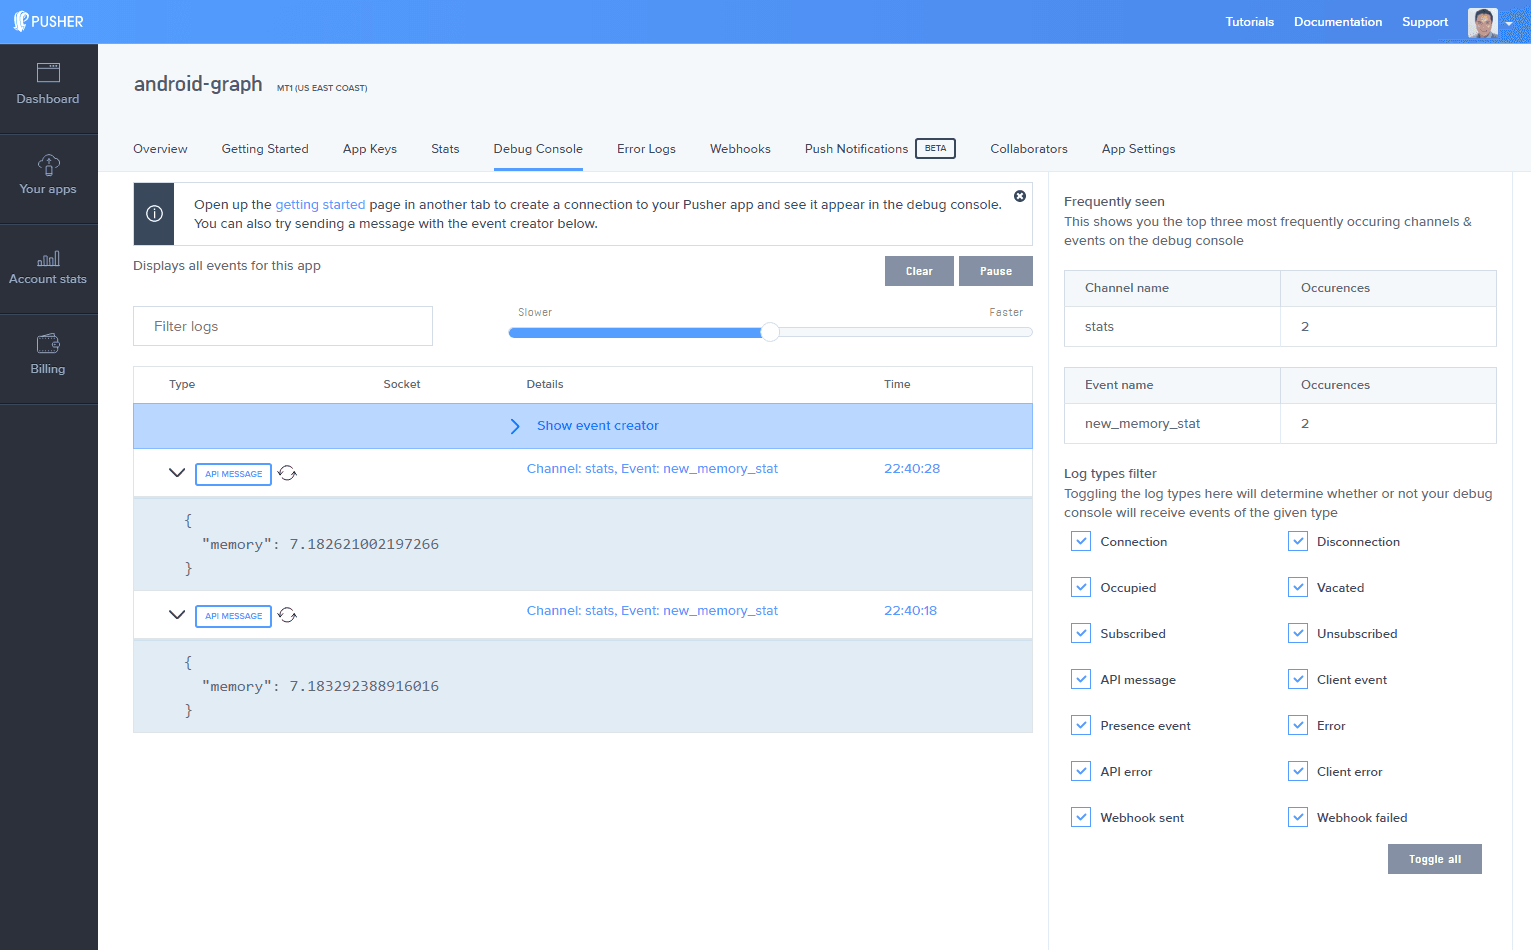
Now let's build the Android app.
Building the Android app
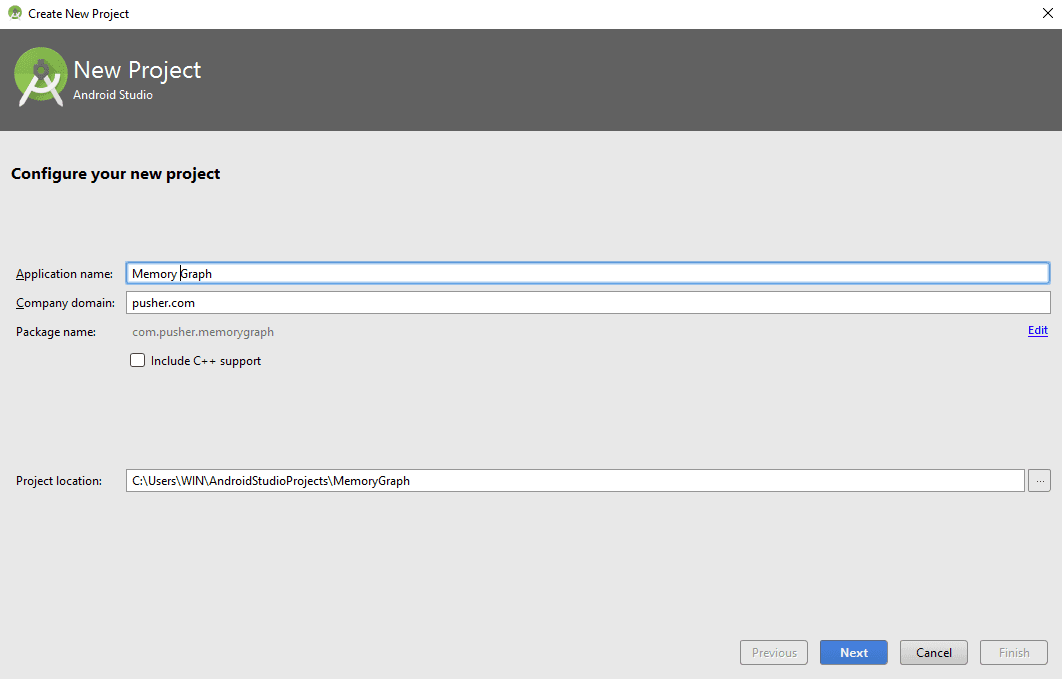
First, make sure to have the latest version of Android Studio. Then, create a new project:
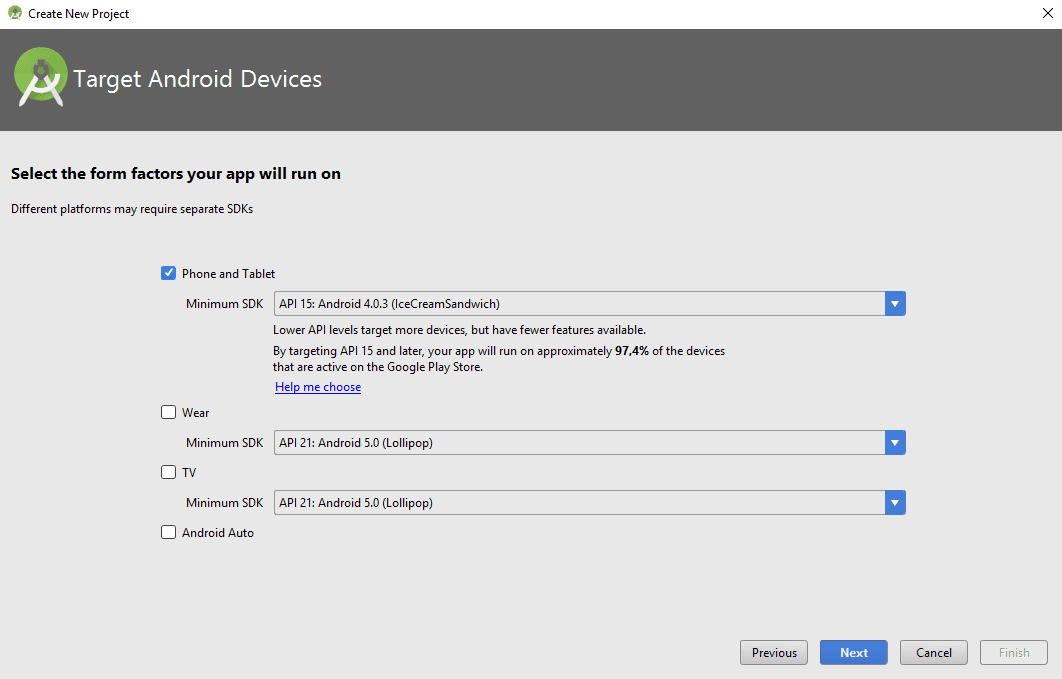
We're not going to use anything special, so we can safely support a low API level:
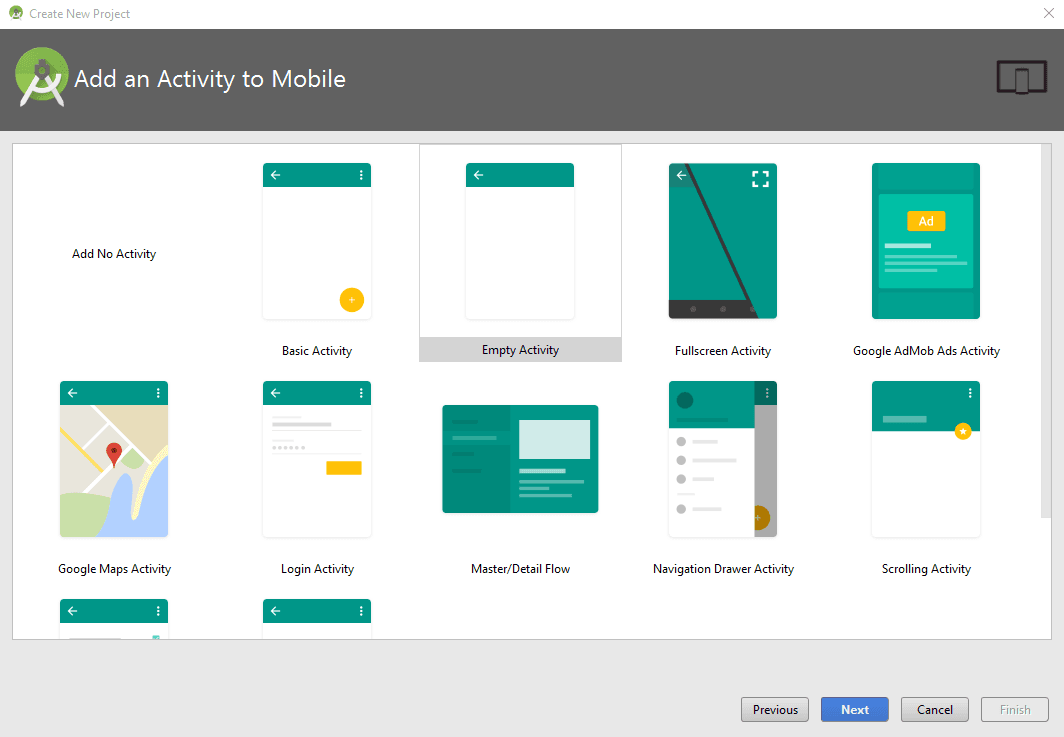
Next, create an initial empty activity:
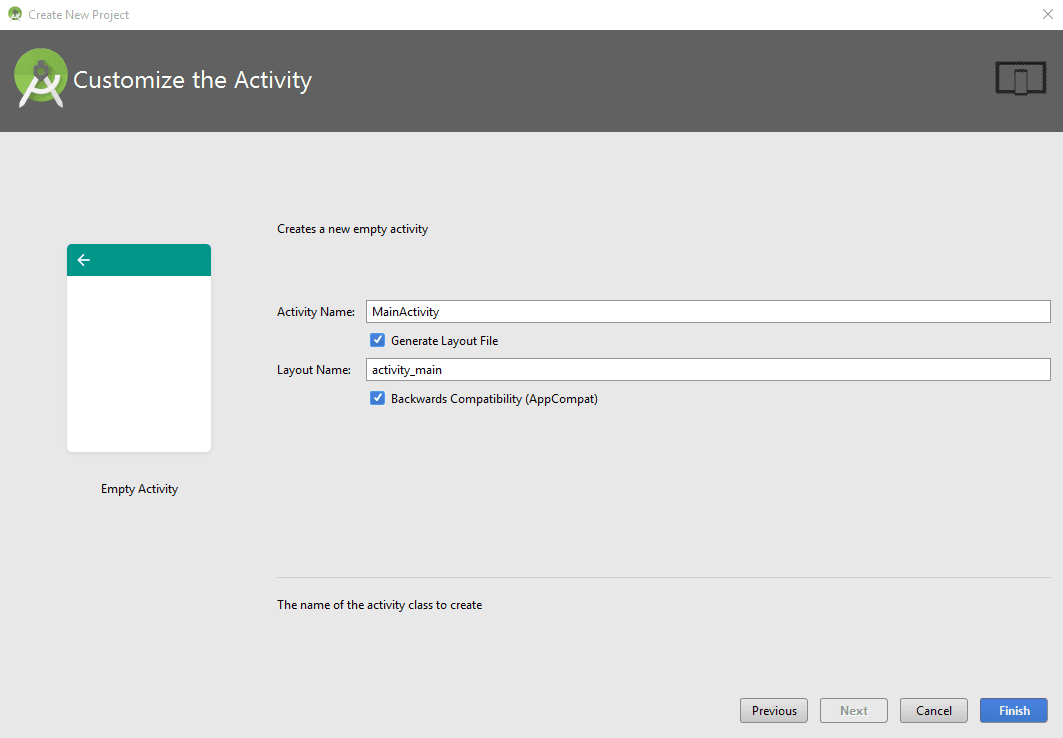
And use the default name of MainActivity with backward compatibility:
Once everything is set up, let's install the project dependencies. First, add the following repository to your project level build.gradle:
1allprojects { 2 repositories { 3 ... 4 maven { url "https://jitpack.io" } 5 } 6}
Next, in the dependencies section of the build.gradle file of your application module add:
1dependencies { 2 ... 3 compile 'com.android.support:recyclerview-v7:25.1.1' 4 compile 'com.github.PhilJay:MPAndroidChart:v3.0.2' 5 compile 'com.pusher:pusher-java-client:1.4.0' 6 compile 'com.google.code.gson:gson:2.4' 7 ... 8}
At the time of writing, the latest SDK version is 25, so that's my target SDK version.
To graph the memory information we're going to use MPAndroidChart, one of the most popular chart libraries for Android.
Sync the Gradle project so the modules can be installed and the project built.
Don't forget to add the INTERNET permission to the AndroidManifest.xml file. This is required so we can connect to Pusher and get the events in realtime:
1<?xml version="1.0" encoding="utf-8"?> 2<manifest xmlns:android="http://schemas.android.com/apk/res/android" 3 package="com.pusher.photofeed"> 4 5 <uses-permission android:name="android.permission.INTERNET" /> 6 7 <application> 8 ... 9 </application> 10 11</manifest>
Now, modify the layout file activity_main.xml to set a line chart that fills all the available space:
1<?xml version="1.0" encoding="utf-8"?> 2<android.support.constraint.ConstraintLayout 3 xmlns:android="http://schemas.android.com/apk/res/android" 4 xmlns:app="http://schemas.android.com/apk/res-auto" 5 xmlns:tools="http://schemas.android.com/tools" 6 android:layout_width="match_parent" 7 android:layout_height="match_parent" 8 tools:context="com.pusher.memorygraph.MainActivity"> 9 10 <com.github.mikephil.charting.charts.LineChart 11 android:id="@+id/chart" 12 android:layout_width="match_parent" 13 android:layout_height="match_parent"/> 14 15</android.support.constraint.ConstraintLayout>
Open the com.pusher.memorygraph.MainActivity class. Let's start by defining some constants, like the info we'll need to instantiate the Pusher object. Also, let's define the total memory of our server as 16 (gigabytes) and set a maximum limit of 12 to draw a limit line in our chart.
1public class MainActivity extends AppCompatActivity { 2 3 private LineChart mChart; 4 5 private Pusher pusher; 6 7 private static final String PUSHER_APP_KEY = "<INSERT_PUSHER_KEY>"; 8 private static final String PUSHER_APP_CLUSTER = "<INSERT_PUSHER_CLUSTER>"; 9 private static final String CHANNEL_NAME = "stats"; 10 private static final String EVENT_NAME = "new_memory_stat"; 11 12 private static final float TOTAL_MEMORY = 16.0f; 13 private static final float LIMIT_MAX_MEMORY = 12.0f; 14 15 ... 16 17}
In the next code block, you can see how the job of configuring the chart is divided into four functions, how Pusher is set up, specifying that when an event arrives, the JSON object will be converted to an instance of the class Stat (that just contains the property memory) and this will be added to the chart with the addEntry(stat) method.
1public class MainActivity extends AppCompatActivity { 2 3 ... 4 5 @Override 6 protected void onCreate(Bundle savedInstanceState) { 7 super.onCreate(savedInstanceState); 8 setContentView(R.layout.activity_main); 9 10 mChart = (LineChart) findViewById(R.id.chart); 11 12 setupChart(); 13 setupAxes(); 14 setupData(); 15 setLegend(); 16 17 PusherOptions options = new PusherOptions(); 18 options.setCluster(PUSHER_APP_CLUSTER); 19 pusher = new Pusher(PUSHER_APP_KEY); 20 Channel channel = pusher.subscribe(CHANNEL_NAME); 21 22 SubscriptionEventListener eventListener = new SubscriptionEventListener() { 23 @Override 24 public void onEvent(String channel, final String event, final String data) { 25 runOnUiThread(new Runnable() { 26 @Override 27 public void run() { 28 System.out.println("Received event with data: " + data); 29 Gson gson = new Gson(); 30 Stat stat = gson.fromJson(data, Stat.class); 31 addEntry(stat); 32 } 33 }); 34 } 35 }; 36 37 channel.bind(EVENT_NAME, eventListener); 38 pusher.connect(); 39 40 } 41 42}
Let's review all the methods defined above. First, setupChart() configures some general options of the chart:
1public class MainActivity extends AppCompatActivity { 2 3 ... 4 5 private void setupChart() { 6 // disable description text 7 mChart.getDescription().setEnabled(false); 8 // enable touch gestures 9 mChart.setTouchEnabled(true); 10 // if disabled, scaling can be done on x- and y-axis separately 11 mChart.setPinchZoom(true); 12 // enable scaling 13 mChart.setScaleEnabled(true); 14 mChart.setDrawGridBackground(false); 15 // set an alternative background color 16 mChart.setBackgroundColor(Color.DKGRAY); 17 } 18 19}
The setupAxes() method configures the options of the X and Y axes and adds the limit line we talked about before:
1public class MainActivity extends AppCompatActivity { 2 3 ... 4 5 private void setupAxes() { 6 XAxis xl = mChart.getXAxis(); 7 xl.setTextColor(Color.WHITE); 8 xl.setDrawGridLines(false); 9 xl.setAvoidFirstLastClipping(true); 10 xl.setEnabled(true); 11 12 YAxis leftAxis = mChart.getAxisLeft(); 13 leftAxis.setTextColor(Color.WHITE); 14 leftAxis.setAxisMaximum(TOTAL_MEMORY); 15 leftAxis.setAxisMinimum(0f); 16 leftAxis.setDrawGridLines(true); 17 18 YAxis rightAxis = mChart.getAxisRight(); 19 rightAxis.setEnabled(false); 20 21 // Add a limit line 22 LimitLine ll = new LimitLine(LIMIT_MAX_MEMORY, "Upper Limit"); 23 ll.setLineWidth(2f); 24 ll.setLabelPosition(LimitLine.LimitLabelPosition.RIGHT_TOP); 25 ll.setTextSize(10f); 26 ll.setTextColor(Color.WHITE); 27 // reset all limit lines to avoid overlapping lines 28 leftAxis.removeAllLimitLines(); 29 leftAxis.addLimitLine(ll); 30 // limit lines are drawn behind data (and not on top) 31 leftAxis.setDrawLimitLinesBehindData(true); 32 } 33 34}
The setupData() method just adds an empty LineData object:
1public class MainActivity extends AppCompatActivity { 2 3 ... 4 5 private void setupData() { 6 LineData data = new LineData(); 7 data.setValueTextColor(Color.WHITE); 8 9 // add empty data 10 mChart.setData(data); 11 } 12 13}
The setLegend() method sets the options of the legend for the data set that will be shown below the chart:
1public class MainActivity extends AppCompatActivity { 2 3 ... 4 5 private void setLegend() { 6 // get the legend (only possible after setting data) 7 Legend l = mChart.getLegend(); 8 9 // modify the legend ... 10 l.setForm(Legend.LegendForm.CIRCLE); 11 l.setTextColor(Color.WHITE); 12 } 13 14}
In turn, createSet() will create the data set for the memory data configuring some options for its presentation:
1public class MainActivity extends AppCompatActivity { 2 3 ... 4 5 private LineDataSet createSet() { 6 LineDataSet set = new LineDataSet(null, "Memory Data"); 7 set.setAxisDependency(YAxis.AxisDependency.LEFT); 8 set.setColors(ColorTemplate.VORDIPLOM_COLORS[0]); 9 set.setCircleColor(Color.WHITE); 10 set.setLineWidth(2f); 11 set.setCircleRadius(4f); 12 set.setValueTextColor(Color.WHITE); 13 set.setValueTextSize(10f); 14 // To show values of each point 15 set.setDrawValues(true); 16 17 return set; 18 } 19 20}
The addEntry(stat) method, the one used when an event arrives, will create a data set if none exists using the above method, add the entry from the Stat instance that is passed as argument, notify the data has changed, and set the options to limit the view to 15 visible entries (to avoid the chart looking crowded):
1public class MainActivity extends AppCompatActivity { 2 3 ... 4 5 private void addEntry(Stat stat) { 6 LineData data = mChart.getData(); 7 8 if (data != null) { 9 ILineDataSet set = data.getDataSetByIndex(0); 10 11 if (set == null) { 12 set = createSet(); 13 data.addDataSet(set); 14 } 15 16 data.addEntry(new Entry(set.getEntryCount(), stat.getMemory()), 0); 17 18 // let the chart know it's data has changed 19 data.notifyDataChanged(); 20 mChart.notifyDataSetChanged(); 21 22 // limit the number of visible entries 23 mChart.setVisibleXRangeMaximum(15); 24 25 // move to the latest entry 26 mChart.moveViewToX(data.getEntryCount()); 27 } 28 } 29 30}
And finally, we override the method onDestroy() to disconnect from Pusher when needed:
1public class MainActivity extends AppCompatActivity { 2 3 ... 4 5 @Override 6 public void onDestroy() { 7 super.onDestroy(); 8 pusher.disconnect(); 9 } 10 11}
And we're done, let's test it.
Testing the app
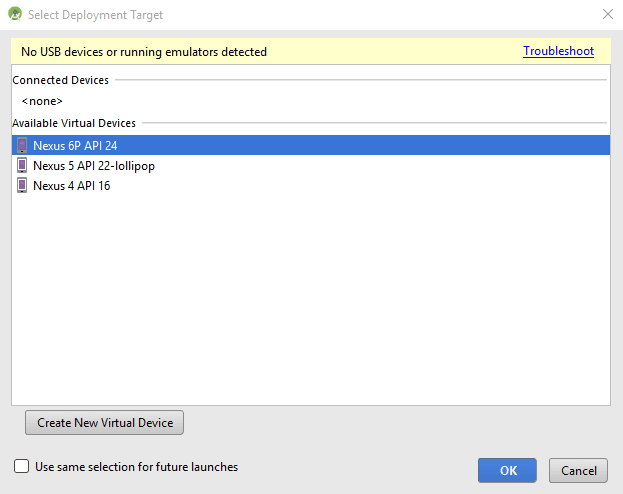
Execute the app, either on a real device or a virtual one:
The following screen will show up:
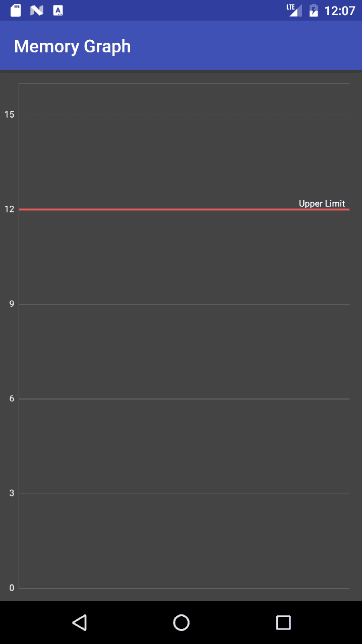
Make sure the Node.js is running. When new data about the memory is received, it will show up in the graph:
Conclusion
Remember that you can find the final version of the Android app here and the Node.js process here.
Hopefully, this tutorial has shown you how simple it is to build a realtime graph in Android with Pusher and MPAndroidChart. You can improve the app by changing the design or type of graphic (a pie chart will work great to see the used vs the free memory), or show more information.
Remember that your free Pusher account includes 100 connections, unlimited channels, 200k daily messages, SSL protection, and there are more features than just Pub/Sub Messaging. Sign up here.


© 2025 Pusher Ltd. All rights reserved.
Pusher Limited is a company registered in England and Wales (No. 07489873) whose registered office is at MessageBird UK Limited, 3 More London Riverside, 4th Floor, London, United Kingdom, SE1 2AQ.