- Products

- Developers
- User stories
- Blog
- Pricing

Build a simple data visualization dashboard with Vue.js and Chart.js
Introduction
Introduction
You all know that data has become an important app of every single app, and even of our lives. Right?! It’s not interesting to have data and not be able to visualize them in a proper way. That’s why in this tutorial we focus on building a simple but useful data visualization app using Vue.js and Chart.js
Demo
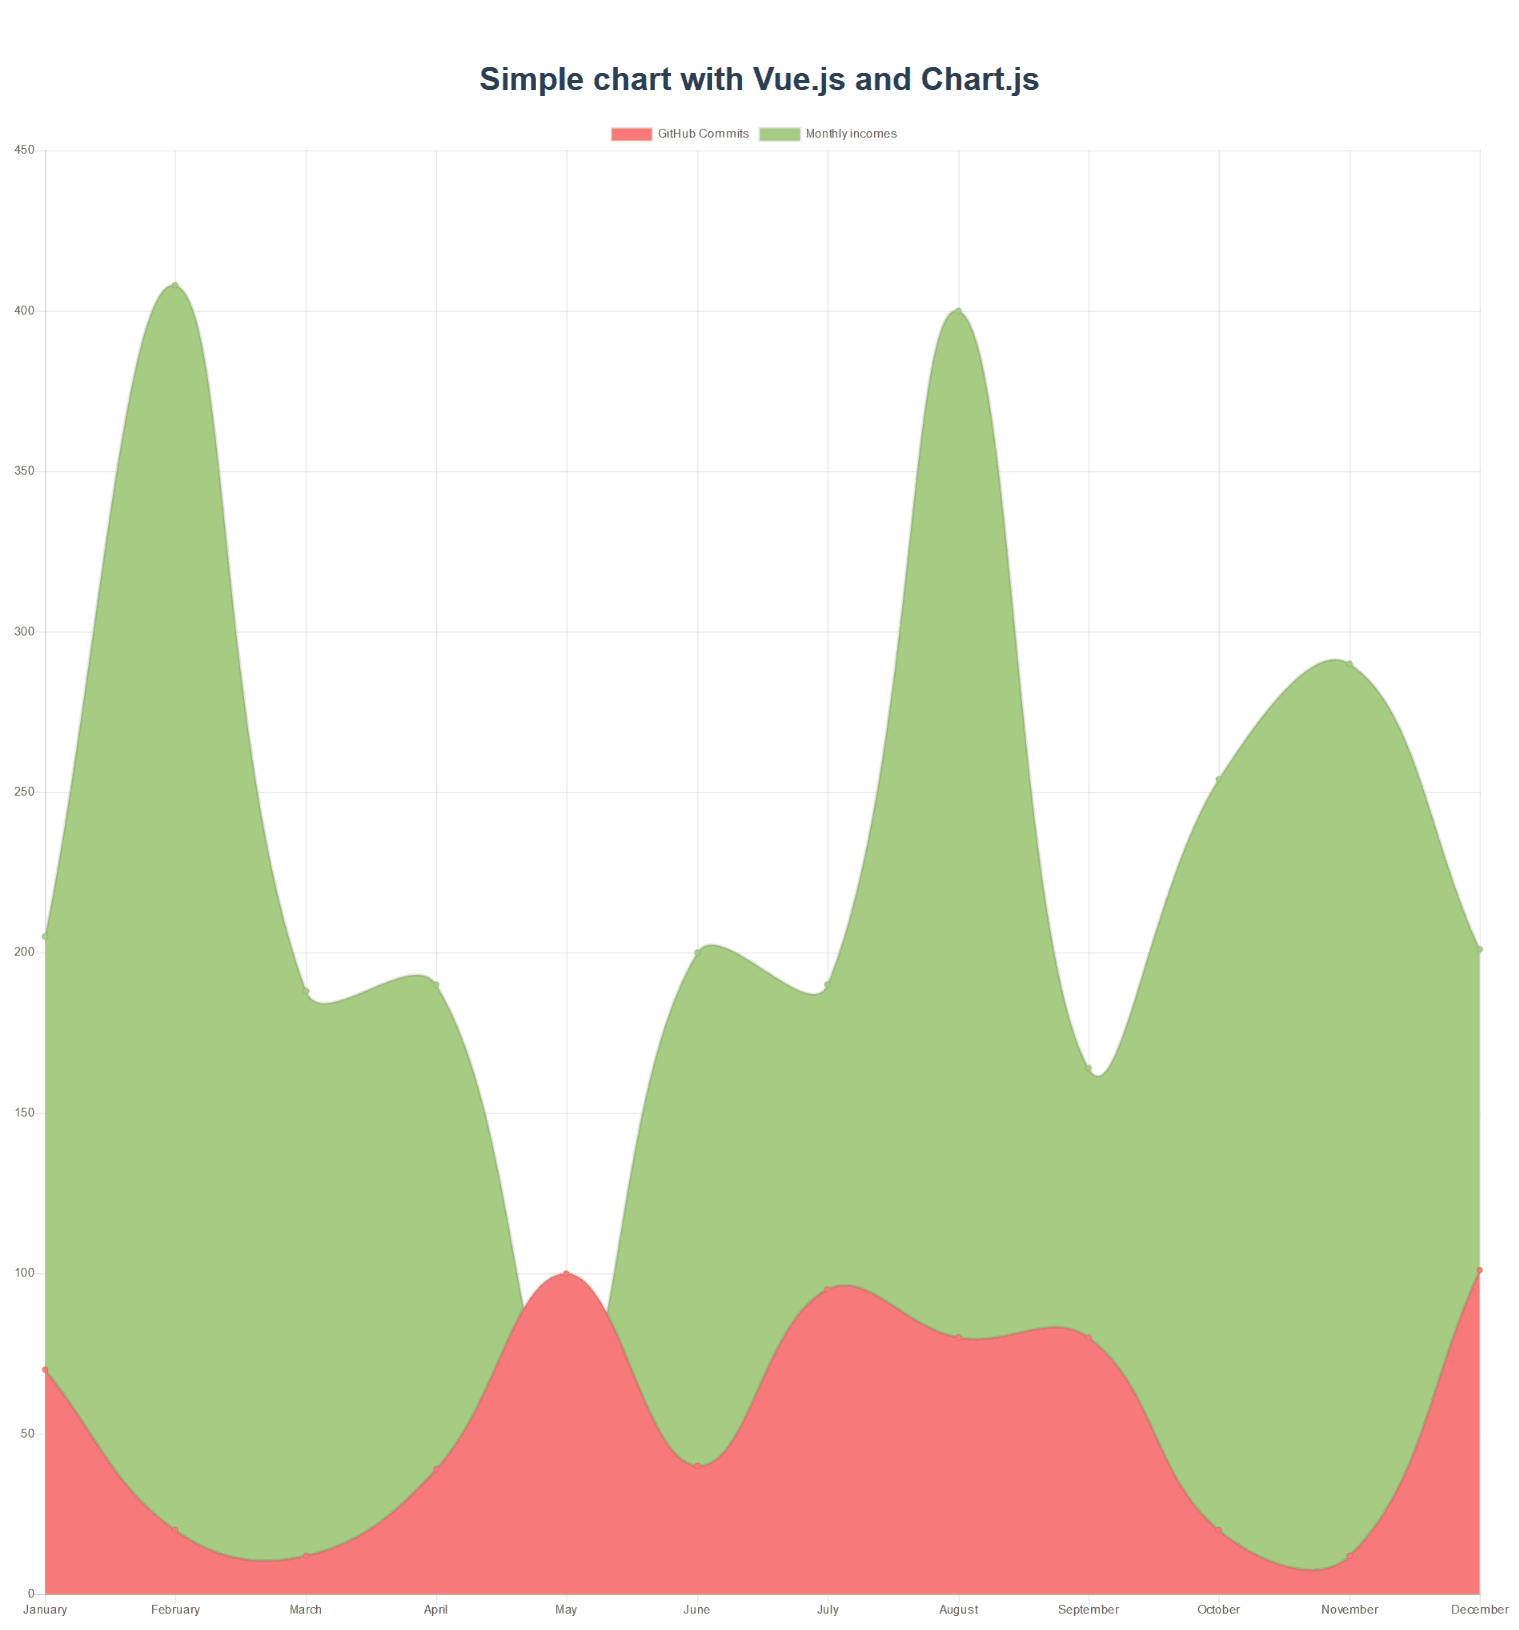
Here is the final result of our app: Nice isn’t it ?! 😁
Prerequisites
In order to follow this tutorial, knowledge of JavaScript and Node.js is required. You should also have the following installed on your machine:
- Node.js (>=8.9.0)
- npm (bundled with Node.js installer) or Yarn
- Vue-CLI
Create the project
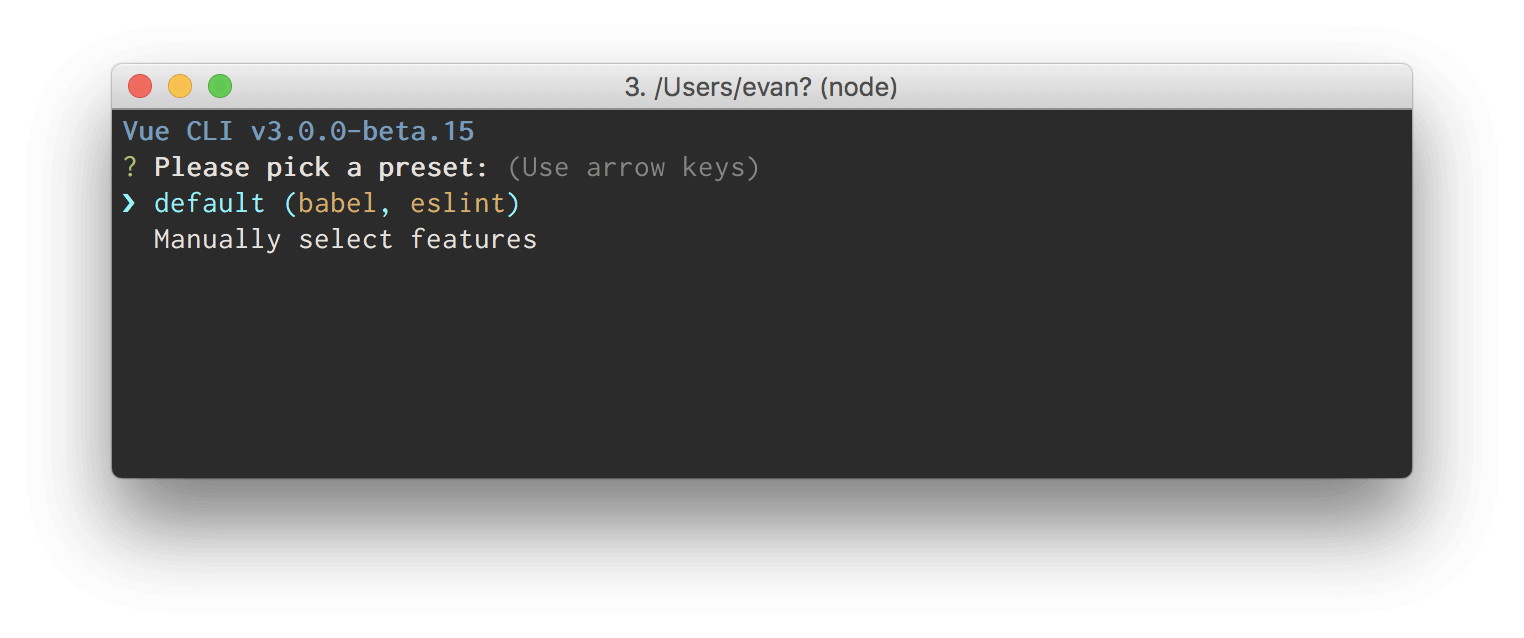
In this tutorial, we’ll use the new Vue CLI to scaffold our project. It is such a great tool that enhances the developer productivity. Head over to your terminal and type this command to create your project: vue create your-project-name. Feel free to name your project as you want 🙃 .
You will be prompted to pick a preset. You can either choose the default preset which comes with a basic Babel + ESLint setup, or select "Manually select features" to pick the features you need.
For the sake of the tutorial, we’ll choose the default preset as it best fits our needs.
At the end of the process, you should be left with a fresh project. But it’s not all, we also have to install some dependencies required to make our app work well. So run this command in your terminal to download them:
yarn add vue-chartjs chart.js
or
npm install vue-chartjs chart.js --save
Build the app
Now create a Chart.js file and paste this code inside:
1//../src/Chart.js 2 import { 3 Line, 4 mixins 5 } from 'vue-chartjs' 6 7 export default { 8 extends: Line, 9 mixins: [mixins.reactiveProp], 10 props: ['chartData', 'options'], 11 data() { 12 return { 13 options: { //Chart.js options 14 scales: { 15 yAxes: [{ 16 ticks: { 17 beginAtZero: true 18 }, 19 gridLines: { 20 display: true 21 } 22 }], 23 xAxes: [{ 24 gridLines: { 25 display: false 26 } 27 }] 28 }, 29 legend: { 30 display: true 31 }, 32 responsive: true, 33 maintainAspectRatio: false 34 } 35 } 36 }, 37 mounted() { 38 this.renderChart(this.chartdata, this.options) 39 } 40 41 }
Let’s have a look at what’s happening here. In the code block above, we imported the Line Chart from vue-chartjs and the mixins module. Chart.js basically does not provide an option for an automatic update whenever a dataset changes but that can be done in vue-chartjs with the help of the following mixins:
- reactiveProp
- reactiveData
These mixins automatically create chartData as a prop or data and add a watcher. If data has changed, the chart will update. You can find more here.
Also, the this.renderChart() function inside the mounted hook function is responsible for rendering the chart. this.chartData is an object containing the dataset needed for the chart and we’ll get that by including it as a prop in the Visualisation.vue component we’ll create soon, this.options contains the options object that determines the appearance and configuration of the chart.
Now create the Visualisation.vue file and paste this code inside:
1//../src/components/Visualisation.vue 2 3 <template> 4 <chart :chart-data="datacollection"></chart> 5 </template> 6 <script> 7 import Chart from "./../Chart.js"; 8 export default { 9 components: { 10 Chart 11 }, 12 data() { 13 return { 14 datacollection: null 15 }; 16 }, 17 mounted() { 18 this.fillData(); 19 }, 20 methods: { 21 fillData() { 22 this.datacollection = { 23 labels: [ 24 "January", 25 "February", 26 "March", 27 "April", 28 "May", 29 "June", 30 "July", 31 "August", 32 "September", 33 "October", 34 "November", 35 "December" 36 ], 37 datasets: [ 38 { 39 label: "GitHub Commits", 40 backgroundColor: "#f87979", 41 data: [70, 20, 12, 39, 100, 40, 95, 80, 80, 20, 12, 101] 42 }, 43 { 44 label: "Monthly incomes", 45 backgroundColor: "#A5CC82", 46 data: [205, 408, 188, 190, 58, 200, 190, 400, 164, 254, 290, 201] 47 } 48 ] 49 }; 50 }, 51 } 52 }; 53 </script> 54 <style> 55 </style>
In this component, we import our Chart.js file; the chart-data property of our chart component permits us to provide it with some data to render in the form of a chart.The datacollection object is populated with some mock data within the fillData method, and as soon as the component is mounted we execute it. It’s that simple 🙃 .
Now import your Visualisation.vue component inside the ../src/App.vue file and change the msg property to the following: Simple data visualisation with Vue.js and Chart.js or whatever you want, and comment the img line. After these changes your App.vue should look like the following:
1//../src/components/App.vue 2 <template> 3 <div id="app"> 4 <!-- <img alt="Vue logo" src="./assets/logo.png"> --> 5 <HelloWorld msg="Simple data visualisation with Vue.js and Chart.js"/> 6 <visualisation></visualisation> 7 </div> 8 </template> 9 <script> 10 /* eslint-disable */ 11 import Visualisation from './components/Visualisation.vue'; 12 import HelloWorld from './components/HelloWorld.vue' 13 14 export default { 15 name: 'app', 16 components: { 17 Visualisation, 18 HelloWorld 19 } 20 } 21 </script> 22 <style> 23 24 #app { 25 font-family: 'Avenir', Helvetica, Arial, sans-serif; 26 -webkit-font-smoothing: antialiased; 27 -moz-osx-font-smoothing: grayscale; 28 text-align: center; 29 color: #2c3e50; 30 margin-top: 60px; 31 } 32 </style>
Run the app
Now, you can run your app with the following command:
yarn run serve
or
npm run serve
If you open your browser at the following location: localhost:8080 you’ll get a nice working data visualization app like mine:
Conclusion
I hope this tutorial has been useful to you and you’ll make use the knowledge you’ve acquired in an awesome app of yours. Feel free to grab the source code of the app here.


© 2025 Pusher Ltd. All rights reserved.
Pusher Limited is a company registered in England and Wales (No. 07489873) whose registered office is at MessageBird UK Limited, 3 More London Riverside, 4th Floor, London, United Kingdom, SE1 2AQ.