Using dynamic imports and webpack to boost page load perfomance
Find our how we improved the Google Lighthouse score for the Pusher dashboard using custom Tachyons, postCSS and ES6 modules compiled with webpack.
Introduction
Recently, we’ve been overhauling the Pusher dashboard. It’s a rails app and the design had fallen behind recent branding evolutions our product website had made.
The old front-end was Sass and jQuery modules compiled with sprockets. To bring it up to modern standards we started from scratch building out a new design system that would use a custom Tachyons build, a little postCSS and a sprinkling of ES6 modules all compiled with webpack.
The hunch was that our old styles were bloated and over specific and using atomic CSS would result in less CSS overall. We could also drop jQuery in favour of vanilla JS due to the evolution of web standards within modern browsers.
Google Chrome contains an auditing tool called Lighthouse within developer tools that gives scores for a website’s performance, accessibility, best practices and SEO. We can use it to check our site’s performance. The old front-end didn’t get a great lighthouse score due to the CSS and JS bundle sizes.
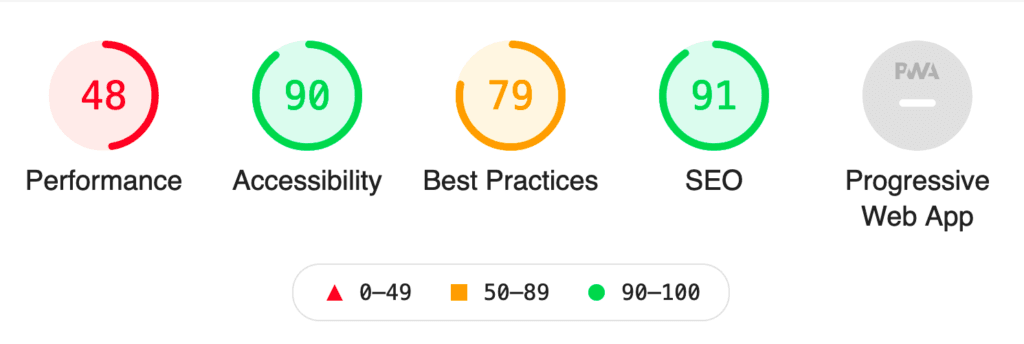
Lighthouse score on emulated 3G mobile device (lighthouse report)
Why do we care about website performance?
The aim in the new system is to be smaller and more performant so that our lighthouse score goes up. This is important because we want our dashboard to load quickly. When the dashboard speed doesn’t meet the expectations of our users, the result is a poor experience. Google Web team’s RAIL performance model suggests users begin to lose focus on the task at hand after just 1 second of delay. Lag on this page can also have a knock on effect to the ranking of our whole domain.
To be able to change the designs incrementally over time we add the webpacker config necessary to compile our new styles and scripts whilst keeping the old ones too. We then used a flag on each page template to set which of the styles to load.
Once we’d transitioned onto the new design system we ran another lighthouse audit to see how things were looking now.
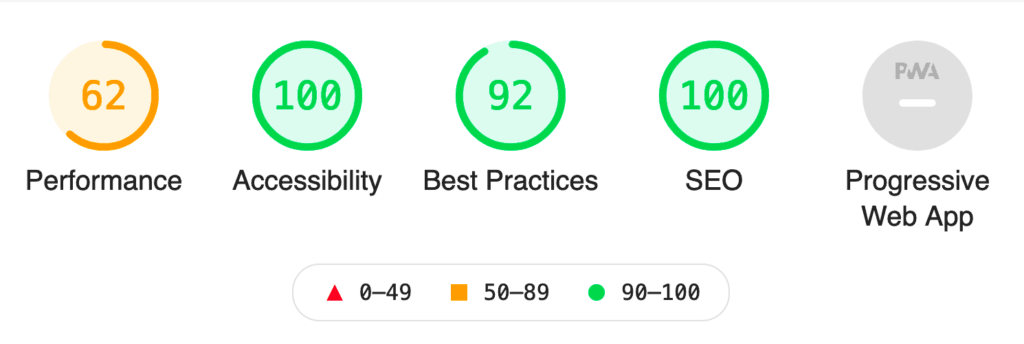
Lighthouse score on emulated 3G mobile device (lighthouse report)
Not bad, but we can do better!
Lazy loading of assets
We include a few third party dependencies in our webpack bundle and some of these are quite big, for example we load Chartkick everywhere even though it’s not used on every page. We also created 7 different bundles, the largest (in beige below) was loaded on every page and the other 6 were loaded in addition on a few pages.

Webpack bundle analyser showing big dependencies
Luckily webpack is set up to deal with situations like this. Using dynamic imports, webpack spots dependencies it can split out into separate chunk files that can be loaded on demand. This is done like so:
1const { Chartkick } = await import( 2 /*webpackChunkName:"chartkick"*/"chartkick" 3);
For this to work well it would be better if every page loaded the same single JS file and we let webpack work out when it needed to lazy load the other chunks. You can see in the above screenshot that each bundle contains runtime.js, so we’re loading this twice on some pages which is wasteful.
Doing this to all our dependencies brought the base bundle (in purple below) down from 2.1MB to 450kB.
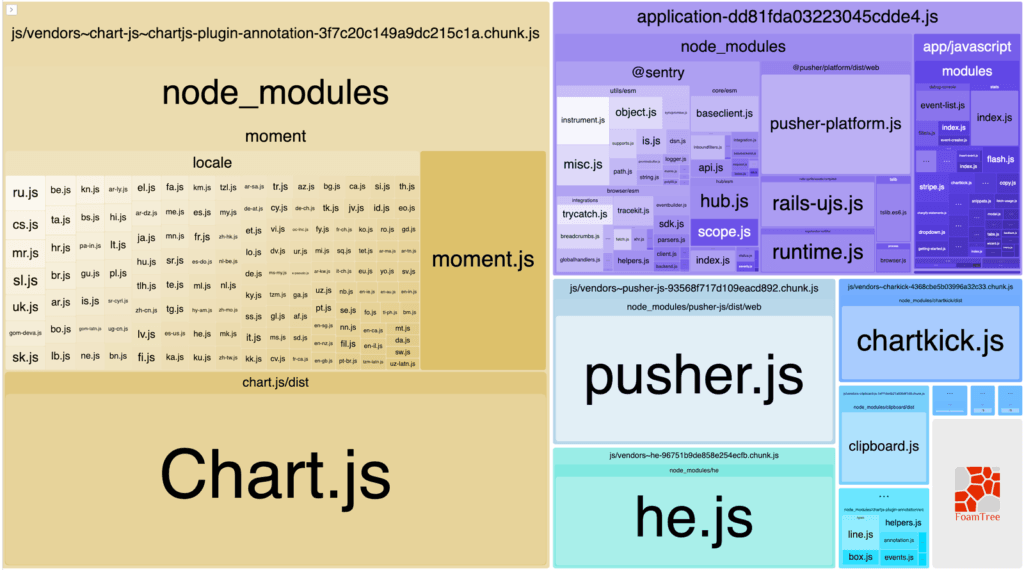
webpack bundle analyser showing big dependencies in separate chunk files
This time we run the Lighthouse audit we can see our score has increased again.
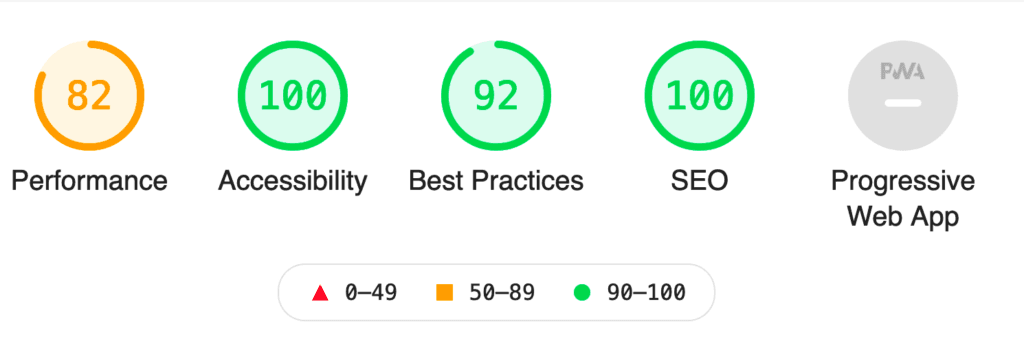
Lighthouse score on emulated 3G mobile device (lighthouse report)
Conclusion
We did the above tests on our staging environment which we use to experiment and take the opportunity to make a bit more of a mess with things before integrating on our production site. The experiments here helped us improve performance significantly on the production site.
We find Lighthouse and webpack bundle analyzer to be indispensable tools in this process. If you are looking to improve performance on your site, we recommend:
- Using the Lighthouse report as a basis for improvement
- Bundle JS assets into one file so that you can make the most of caching
- Using dynamic imports so Webpack can split your bundle into chunks
Further opportunities
In the future we’d like to get our score even higher. There are further improvements we could make to improve our score using HTTP/2, better caching and further JS/CSS optimisations.
We’d also like to automate our score using Lighthouse CI or perhaps using a Github integration with Calibre App.