Debug Console Updates
We’ve added the ability to filter which logs you want to see as well as the rate at which you want new logs to be added to the table.
Introduction
If you’ve used the debug console for one of your Pusher apps in the last couple of weeks you might have noticed some changes. Yesterday we made another addition, which, combined with the other updates, should make using the debug console substantially better!
The most noticeable changes are at the top of the debug console. We’ve added the ability to filter which logs you want to see as well as the rate at which you want new logs to be added to the table.
Filtering
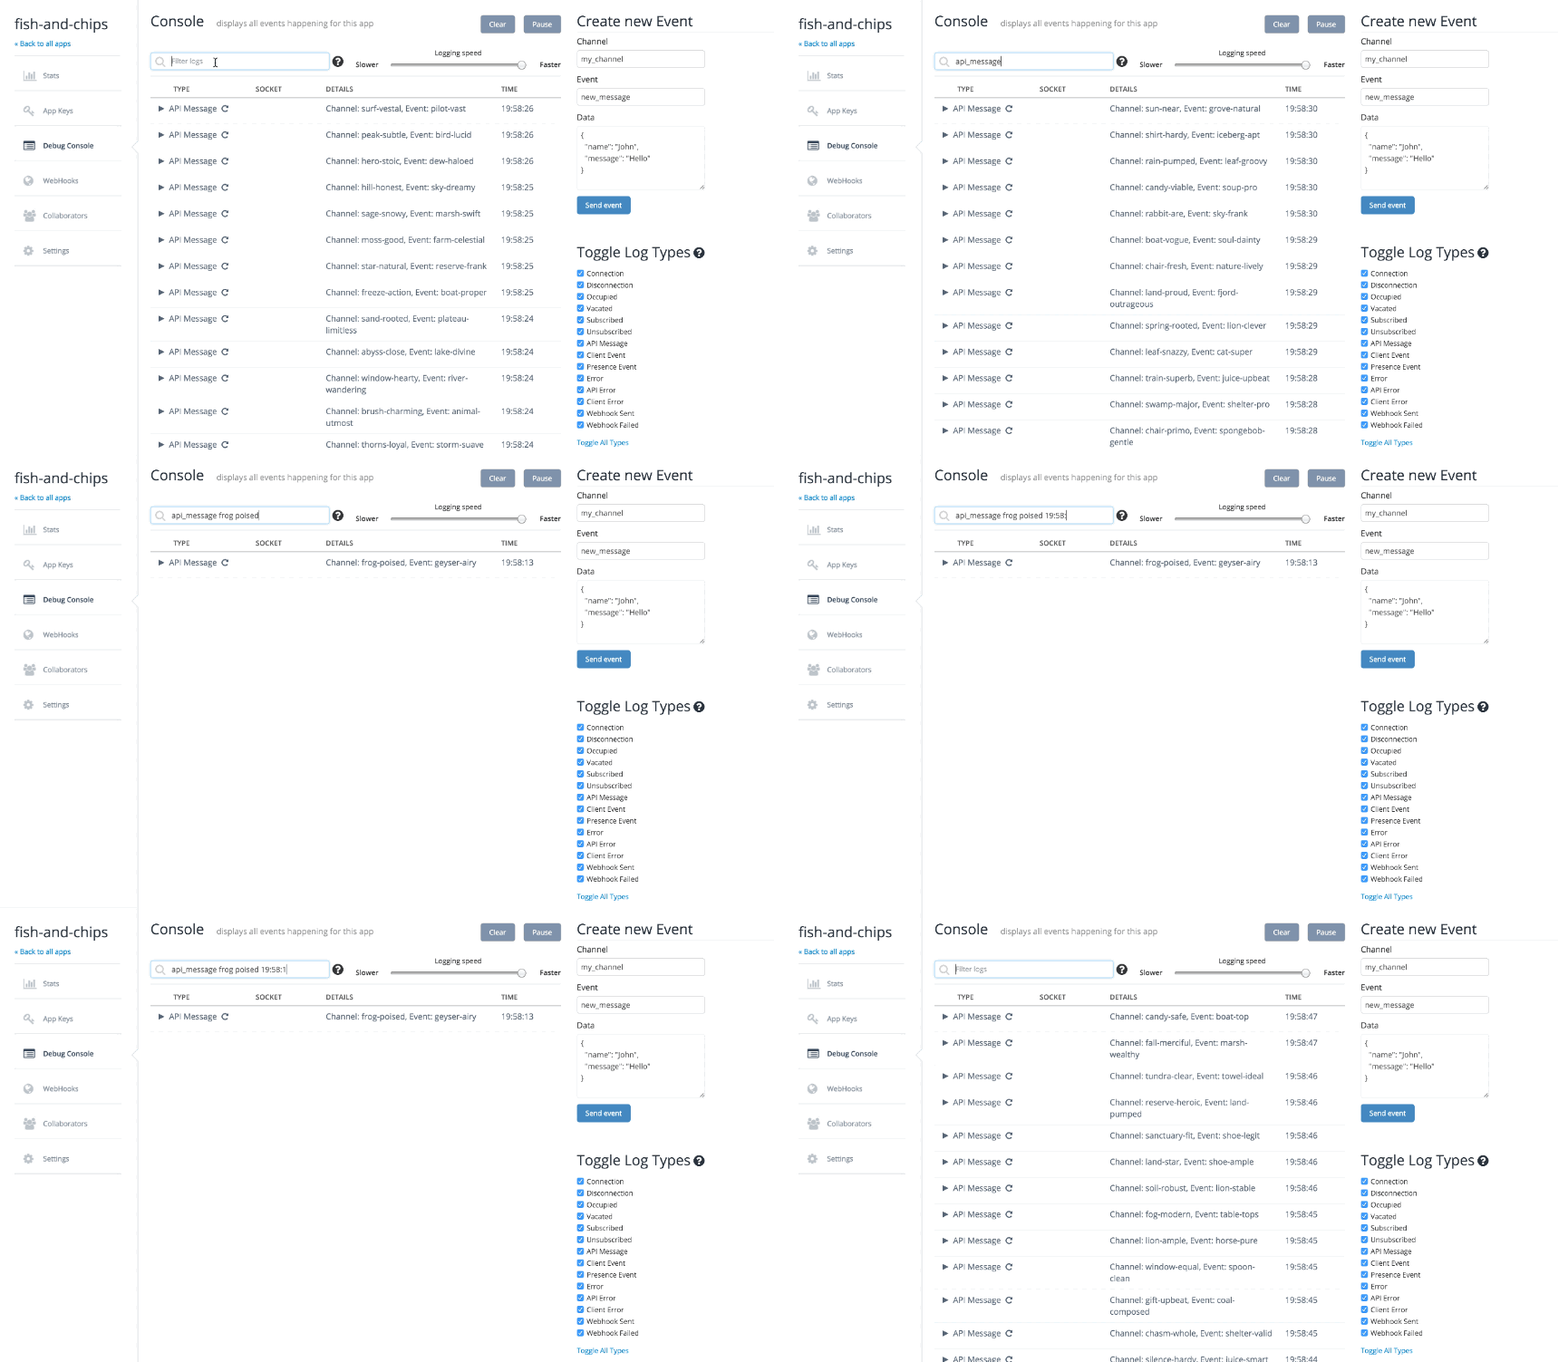
Using the search input you can filter the table of logs based on channel or event name, log type, payload, or even timestamp. So, for example, if you wanted to see all of the API messages in the debug console that were sent to a channel called my-favourite-channel and the payload contains the text “spongebob” then all you’d have to do is type “api message my-favourite-channel spongebob”, and voilà, there are the relevant API messages.

Filtering logs in the debug console using the search input
Logging speed
It’s even easier to use the new logging speed slider.
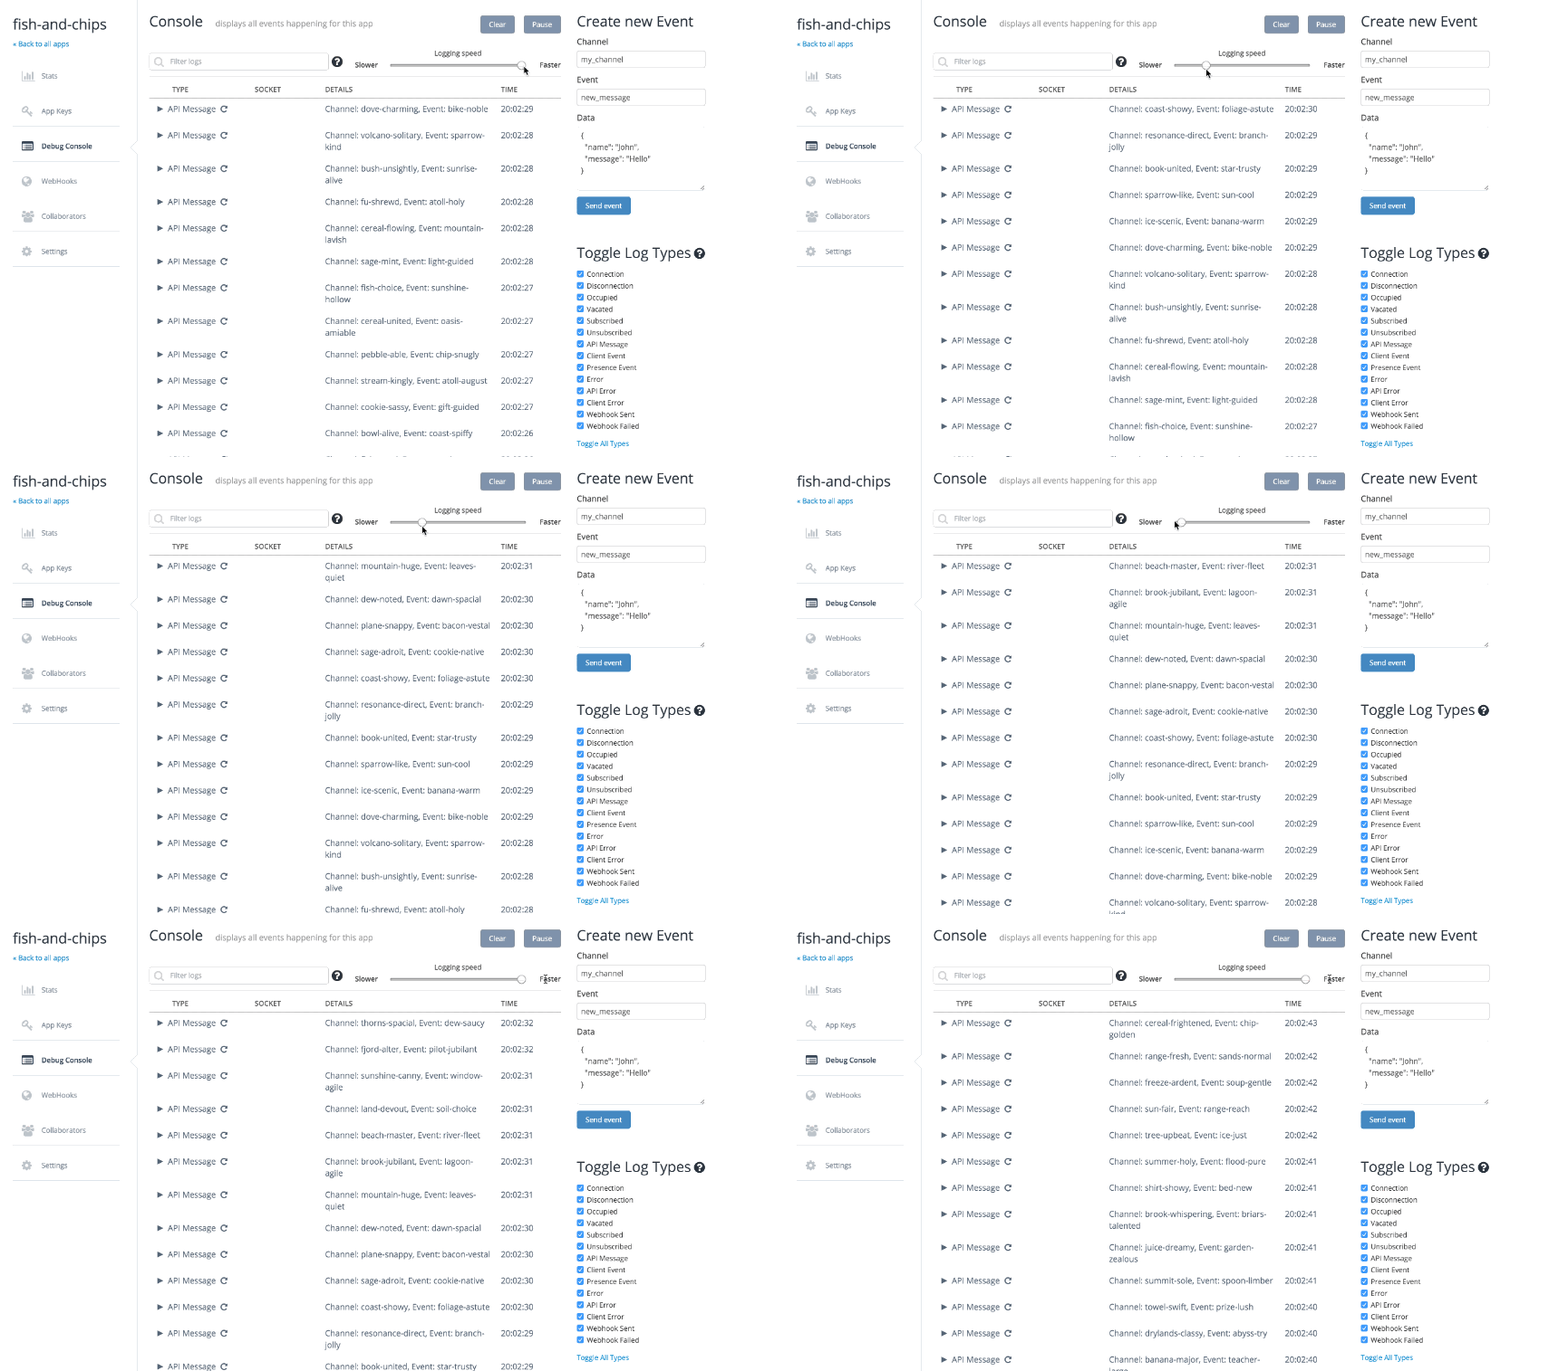
Logs appearing too quickly for your eyes to make sense of them? No problem, just drag the slider to the left and give your eyes a break.

Throttling the logging speed using the slider
Toggling log types
Some of you may have experienced trying to use the debug console with one of your apps that you’re using in production and found that it wasn’t at all practical due to the barrage of logs trying to be processed by your browser. You can of course still use the pause functionality to give you and your browser a breather and some time to digest all the logs. However, sometimes that’s not useful, and all you really want is say, only the webhook-related events to be shown.
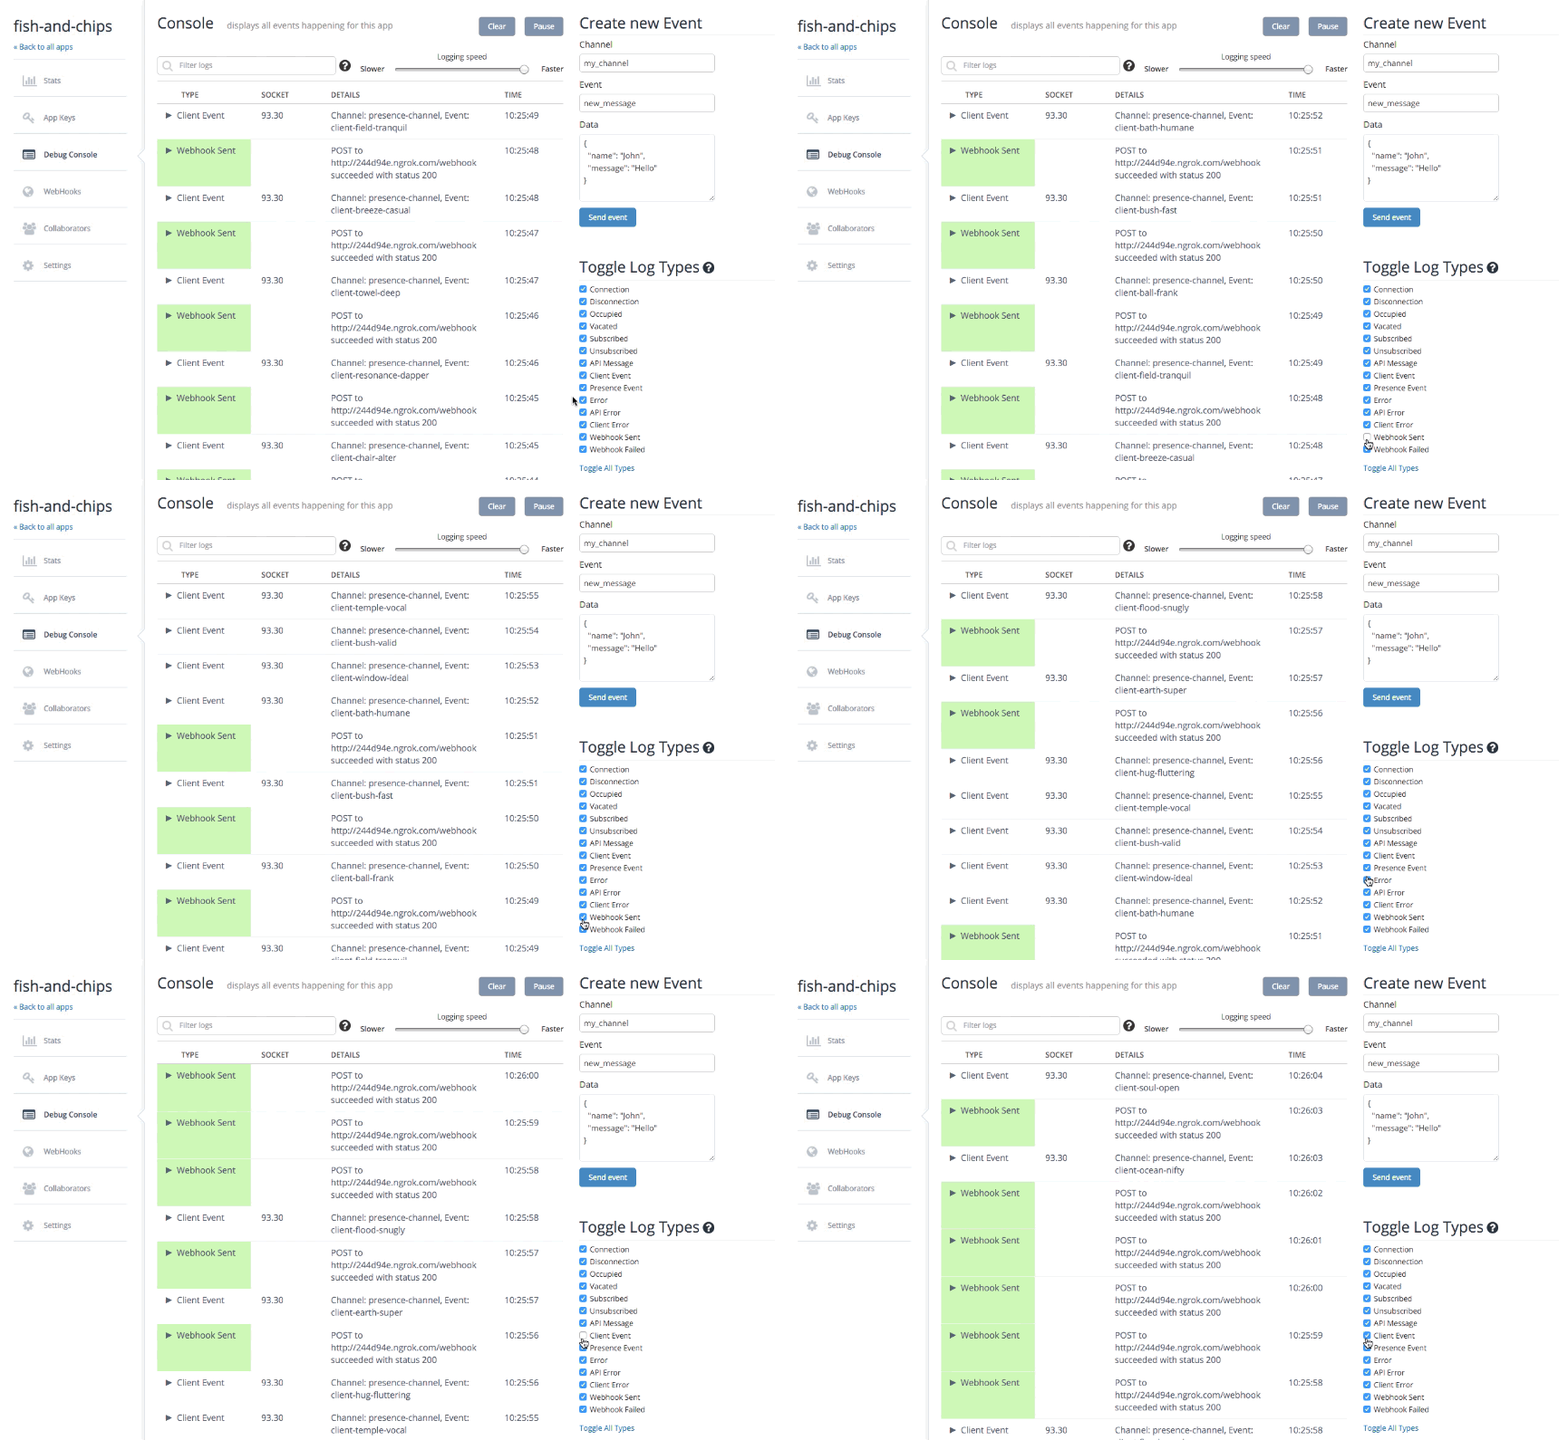
We’ve added the option to toggle the logs that your browser will receive with some checkboxes at the side of the debug console. This is especially useful for very high-volume apps as it will mean your browser won’t ever even need to receive the logs from other logs types.

Toggling “webhook sent” and “client event” log types
Frequently seen channels and events
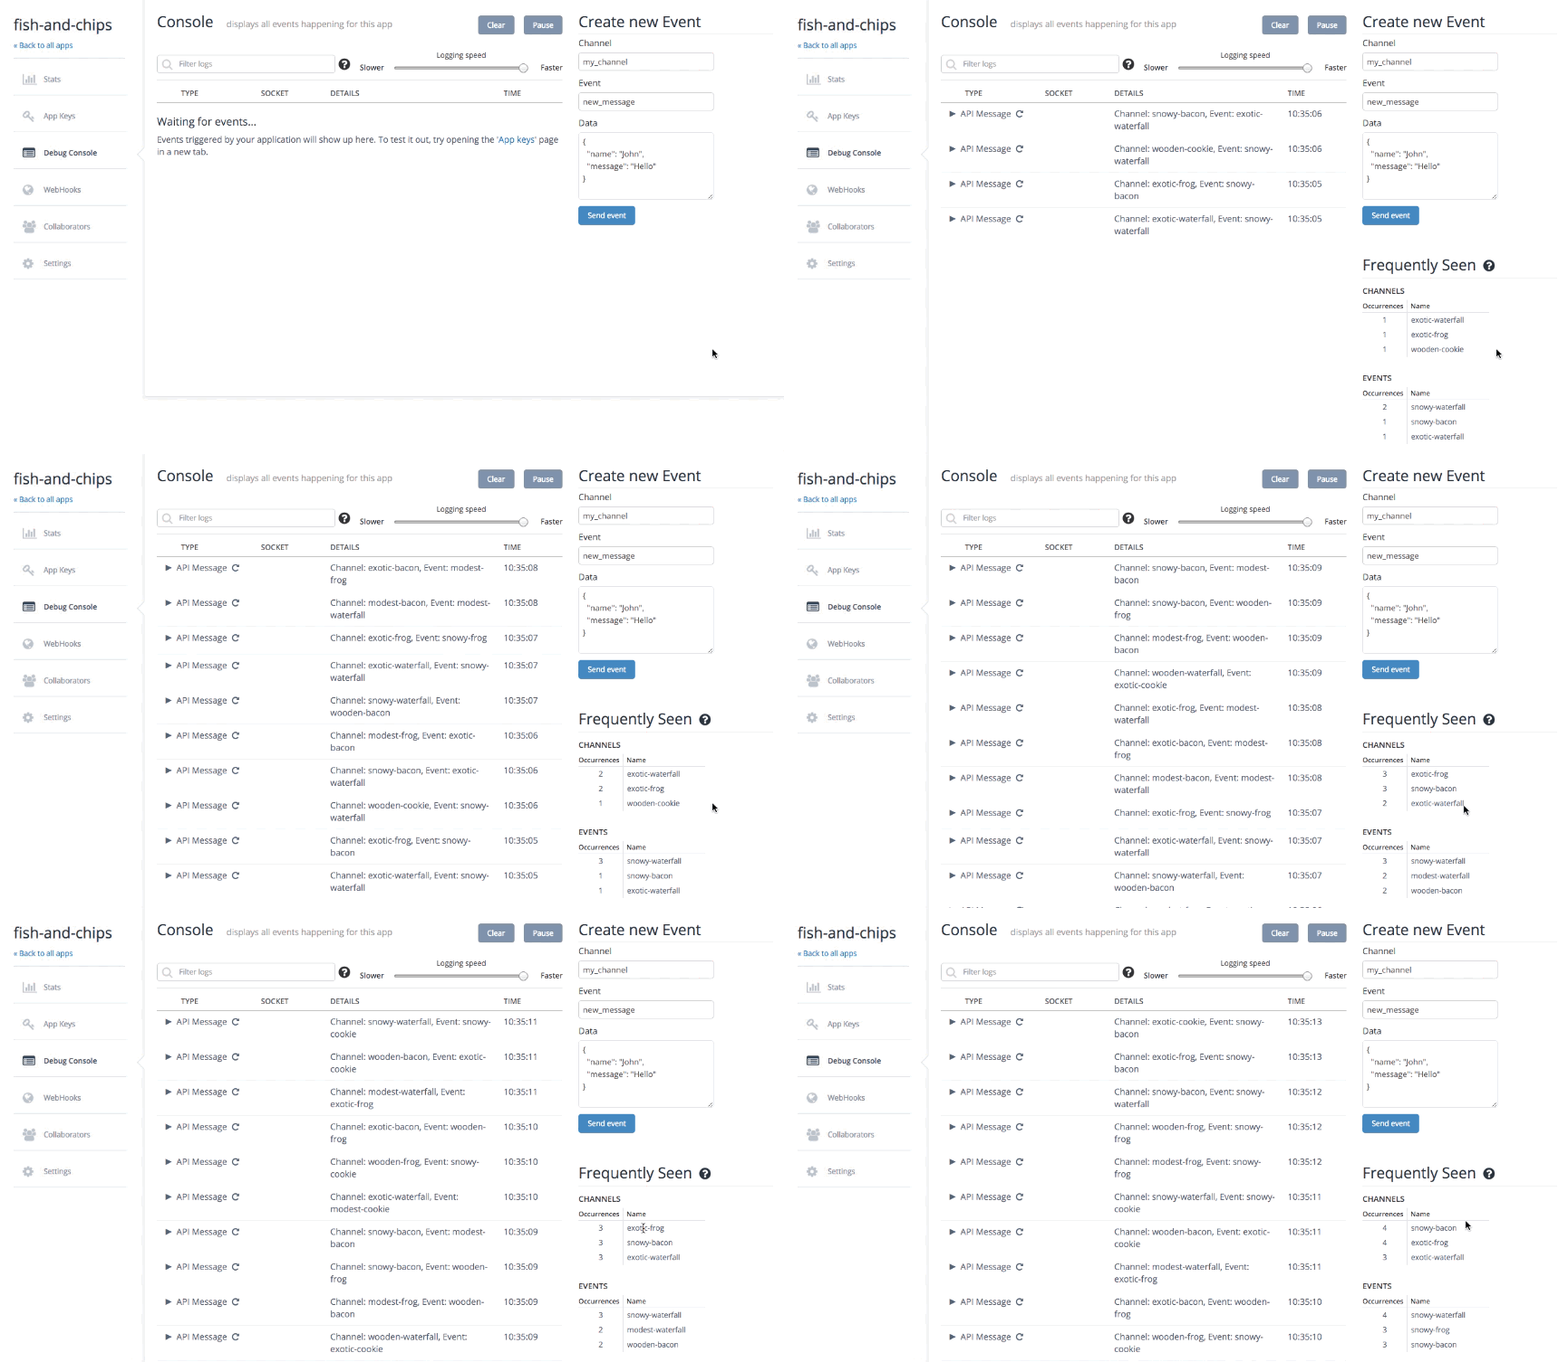
You’ll find a further addition to the side of the debug console. This is in the form of a couple of tables containing information about the channel and event names for which the highest number of API message and client event logs have been received by the debug console. These tables will show the 3 most frequently seen channel and event names since you, the user, opened the debug console page.

Frequently seen channel and event name tables being updated
Those are the visible features worth commenting on. We’ve also done a fair amount of “invisible” work which has resulted in a much better performing debug console. This should again be particularly apparent for high-volume apps and with the new features that enable you to filter, throttle and selectively receive logs, we’re hoping that the debug console has become significantly more useful for all users.
If you’ve spotted any bugs or have any feedback or requests then don’t hesitate to let us know!