Debugging
We offer a number of really useful features that can help you during development and whilst trying to get to the bottom of problems with your application.
∞ Viewing application events in the Channels Debug Console
The Channels Debug Console can be found within the Channels dashboard and can be used to help you understand what’s happening within your Channels application.
It will initially indicate if you can connect or not - if you can connect you might briefly see a connection warning dialog. If you can’t connect the connection warning dialog will stay visible.
Once you have connected you can check that connections are being opened and closed, subscriptions are being made, channels are becoming occupied and vacated, messages are being received by our API for your application, and whether or not webhooks are being sent successfully or not. This feature can be really handy during development or when trying to troubleshoot why certain features in your application might not be working.
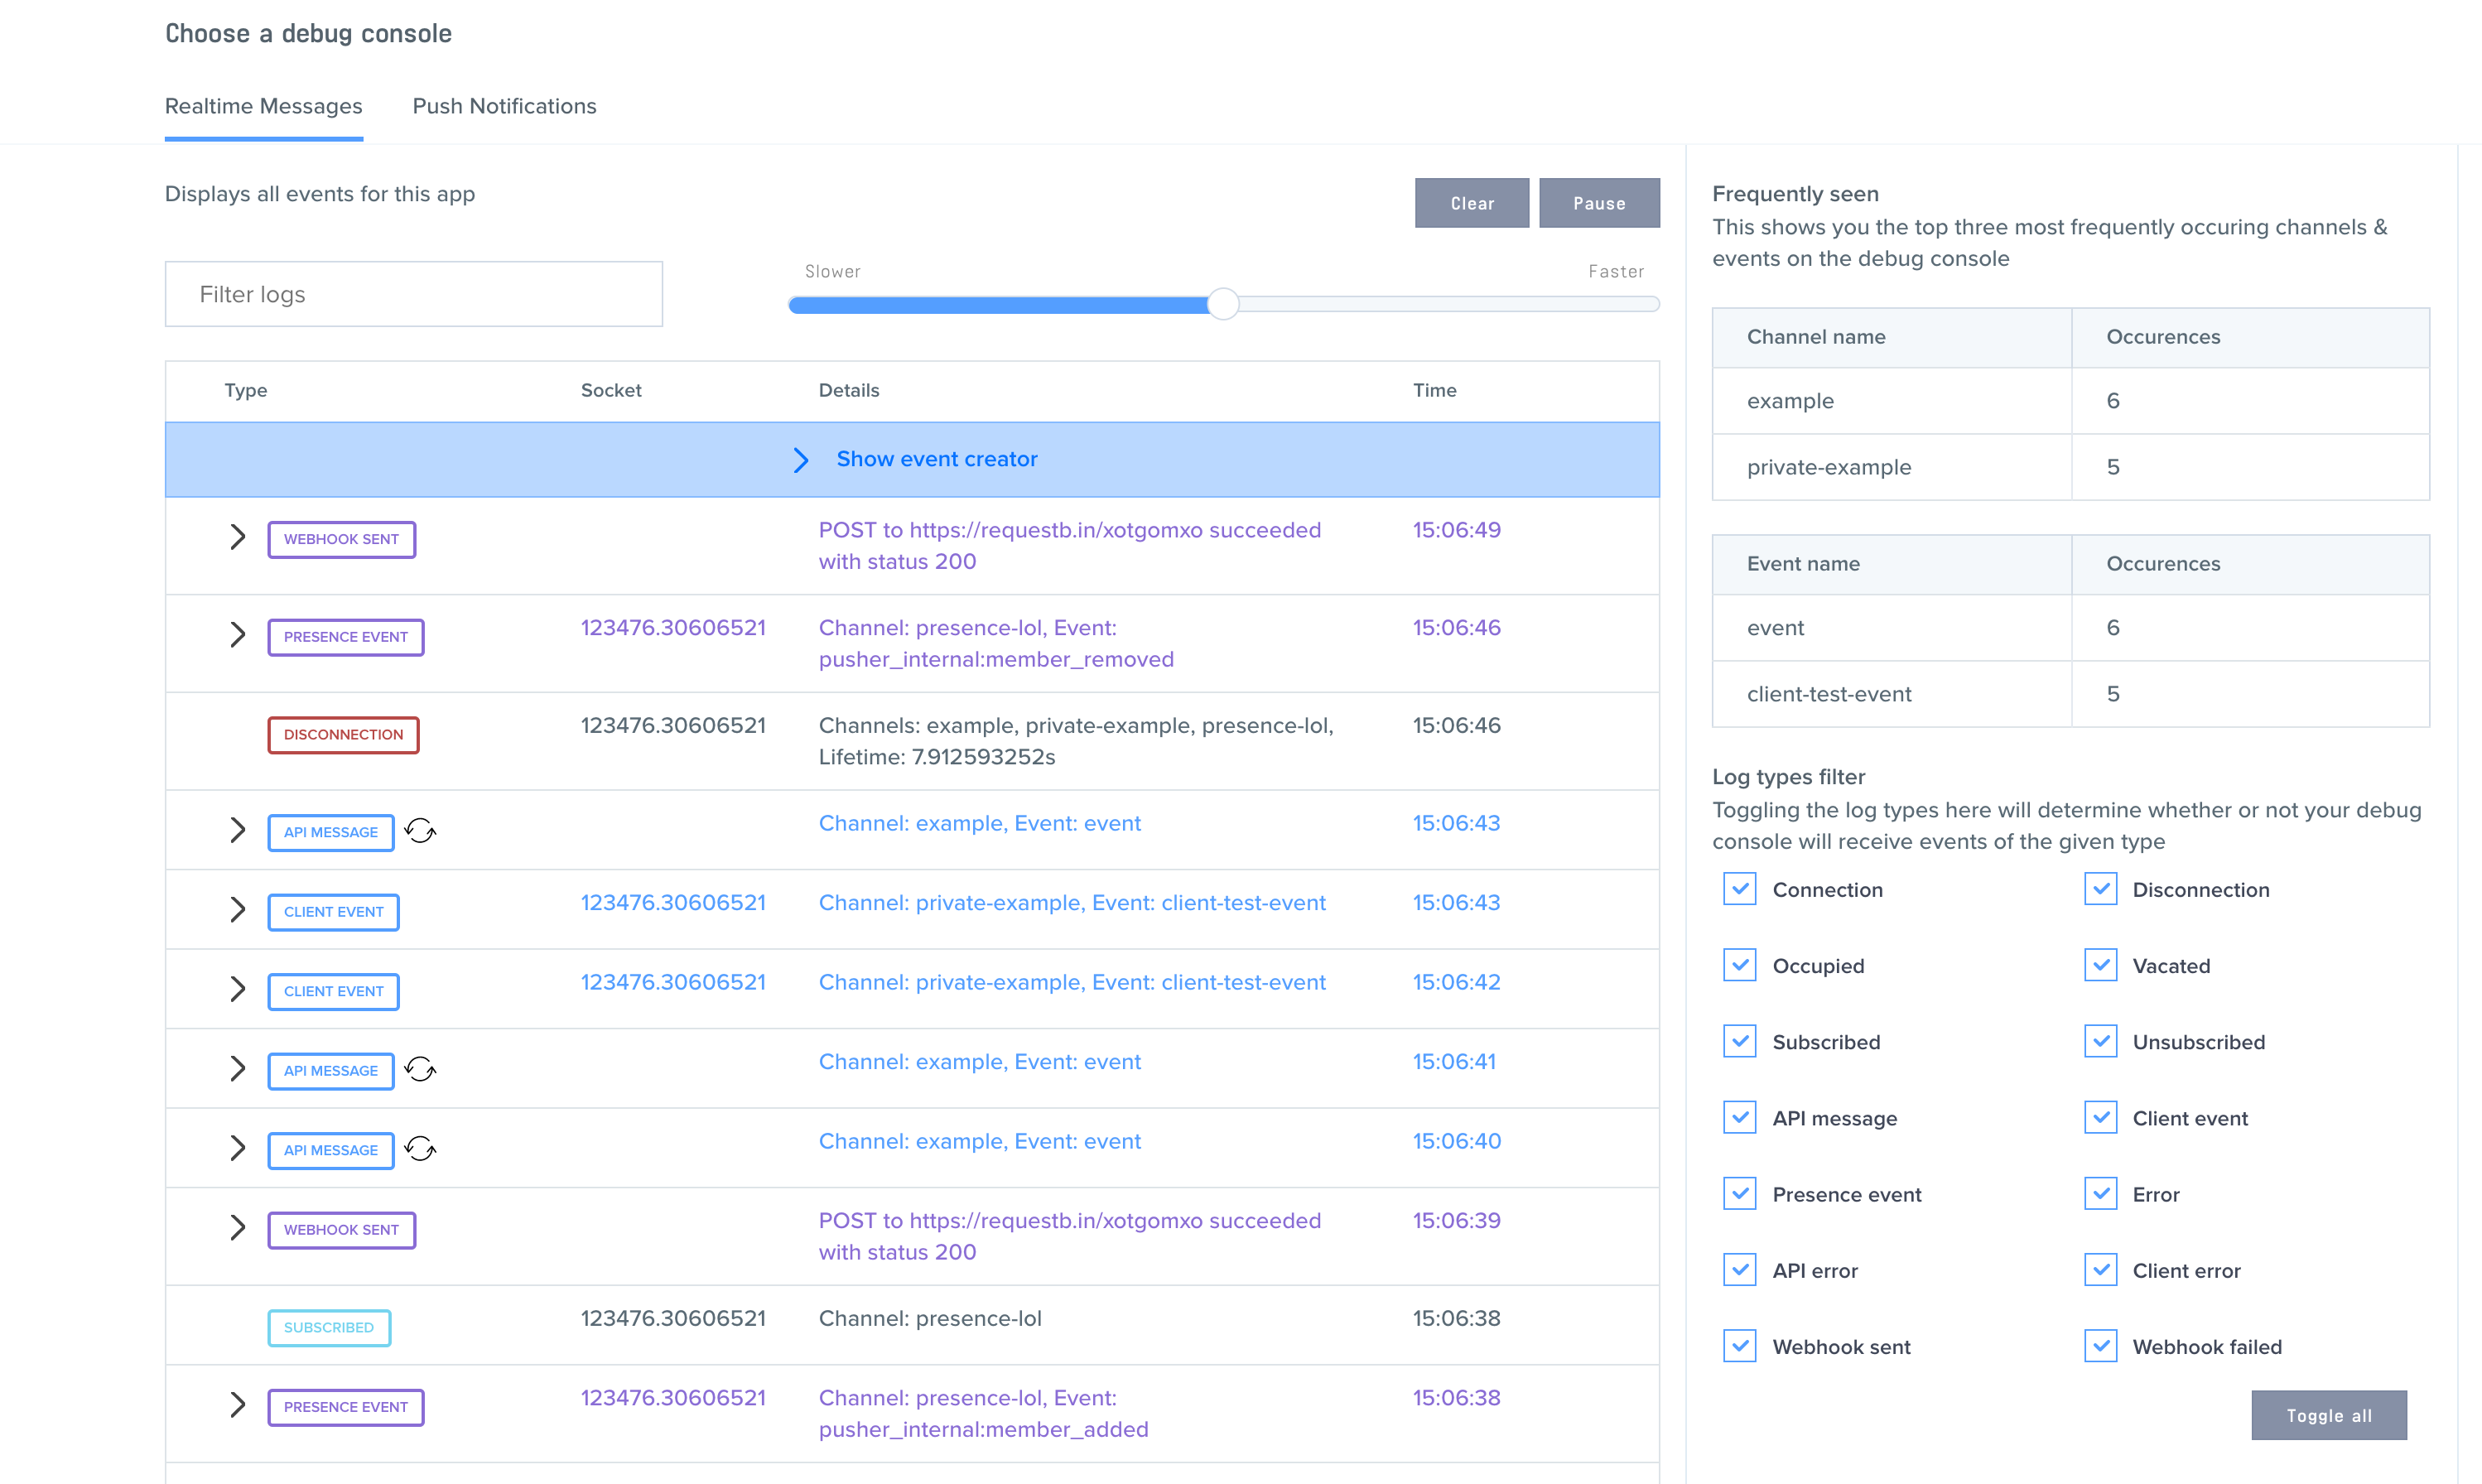
You can also filter which logs will be displayed in the debug console by using the search input. You can filter based on channel name, event name, log type (e.g. api message), data in the message payload, and even timestamp (e.g. 12:35:11).
There are checkboxes that allow you to selectively subscribe to a certain subset of types of logs. This is especially useful if you’ve got a specific problem that you’re trying to debug and are only interested in one type of log.
If you or your browser is finding it hard to keep up with the rate at which logs are being added to the debug console then you can use the logging speed slider at the top of the debug console to slow down the rate at which they’re added to the table.
∞ Logging application events on a channel using the Pusher CLI
The Pusher CLI makes it very easy to see events and parse them as you would standard text. This can be helpful while debugging issues over the longer term. You can read more on how to set up the Pusher CLI here.
To log events on a particular channel, try the following (replacing APP-ID and CHANNEL with your own)
pusher channels apps subscribe --app-id APP_ID --channel CHANNELYou can of course pipe the output of this to a text file for more long term logging.
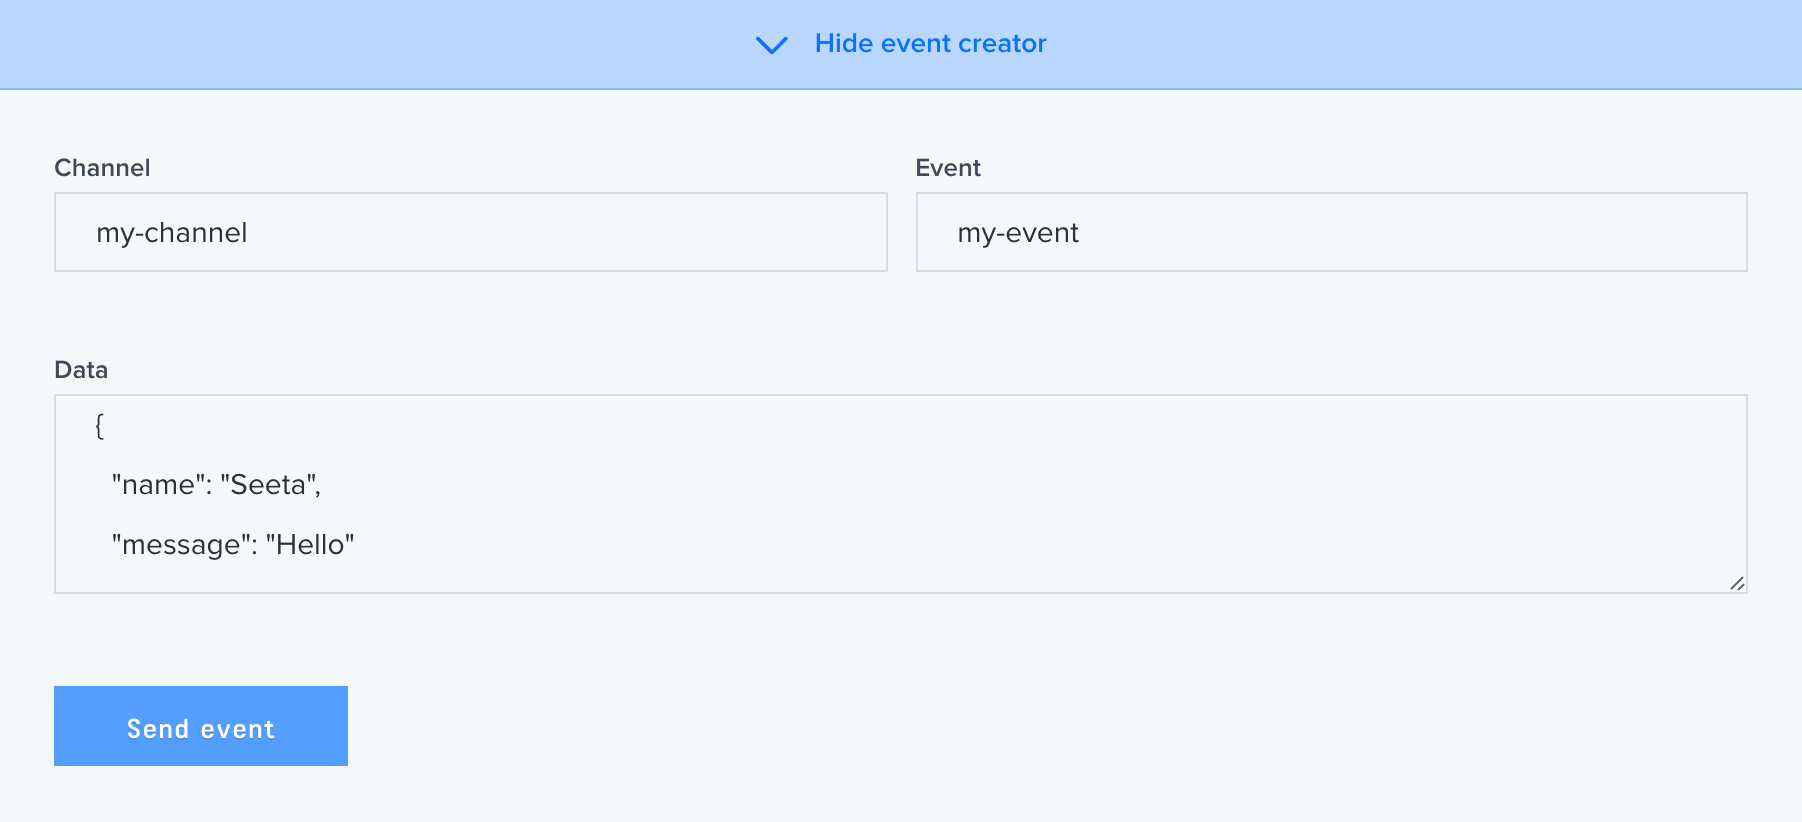
∞ Sending test events using the Event Creator
The Event Creator is a really handy tool that lets you trigger an event on any channel with any event data directly from your Channels app dashboard. This feature means you can write your client code to subscribe to a channel and consume an event without the need to write any server code to start off with. It can also be used for checking that your client application is behaving as expected. Note that you can’t currently trigger client events using the debug console though.
∞ Enable logging in the Channels JavaScript library
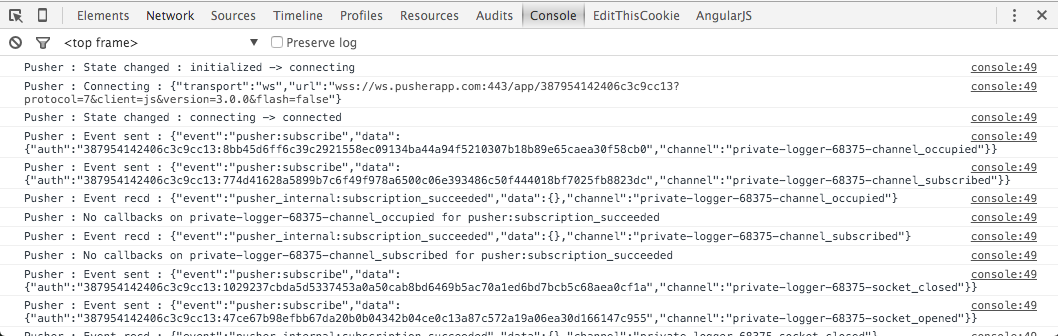
To make Channels a bit more chatty about what is coming in via the socket connection, you can turn on debugging before you initialise your Channels object.
Pusher.logToConsole = true;This should create output like the following in your browser (Chrome in this example):
It’s also possible to overwrite the default logging behaviour.
Pusher.log = function(message) { // custom logging logic };∞ Automated Diagnostics
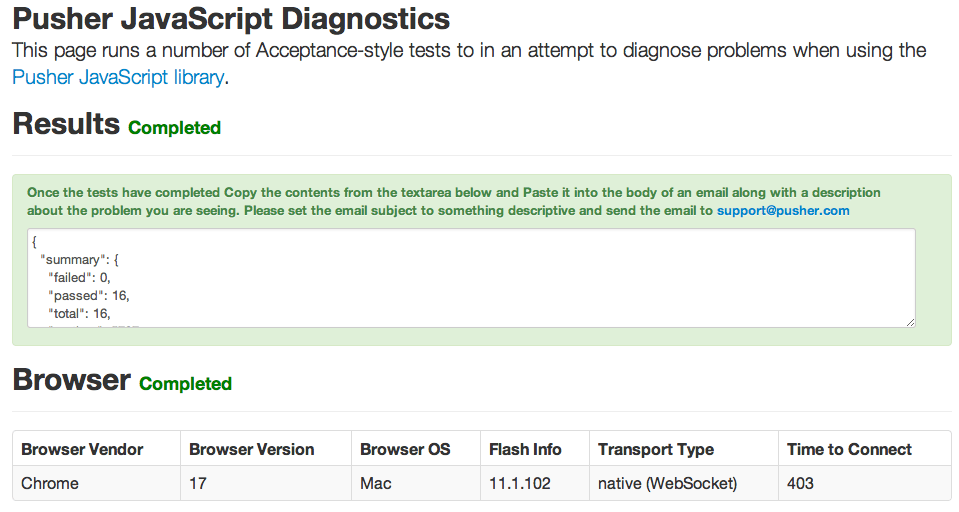
We have a Channels Diagnostics application that runs a number of tests related to the runtime environment (the browser) and the features offered by the Channels JavaScript library. If you still can’t get to the bottom of a problem running the diagnostics and then getting in touch with support is a good next step.
∞ Where next?
If you’re experiencing a client-side problem then you can visit test.pusher.com and see what the logs generated there say. If there appears to be a problem then please copy the output and send this attached to a support request to our support team.
If you’re experiencing any other type of problem related to Channels then please give us a shout, and we’ll check whether there is a problem we can help you with.